ChartPixel
Open siteIntroduction
AI tool for easy data visualization and insights extraction.
ChartPixel Product Information
ChartPixel is an AI-powered data analysis and visualization platform that turns messy data into interactive charts, maps, and actionable insights. It emphasizes no-code ease, AI-assisted analysis, and clear, explainable outputs, enabling users—from beginners to professionals—to quickly transform data into presentations and decisions. The tool supports uploading Excel/CSV data, auto-generating charts, AI-written insights, forecasts, and one-click export to PowerPoint, with sharing capabilities via links. It also prioritizes data security by avoiding training on your data or sending raw data to external LLMs.
How ChartPixel Works
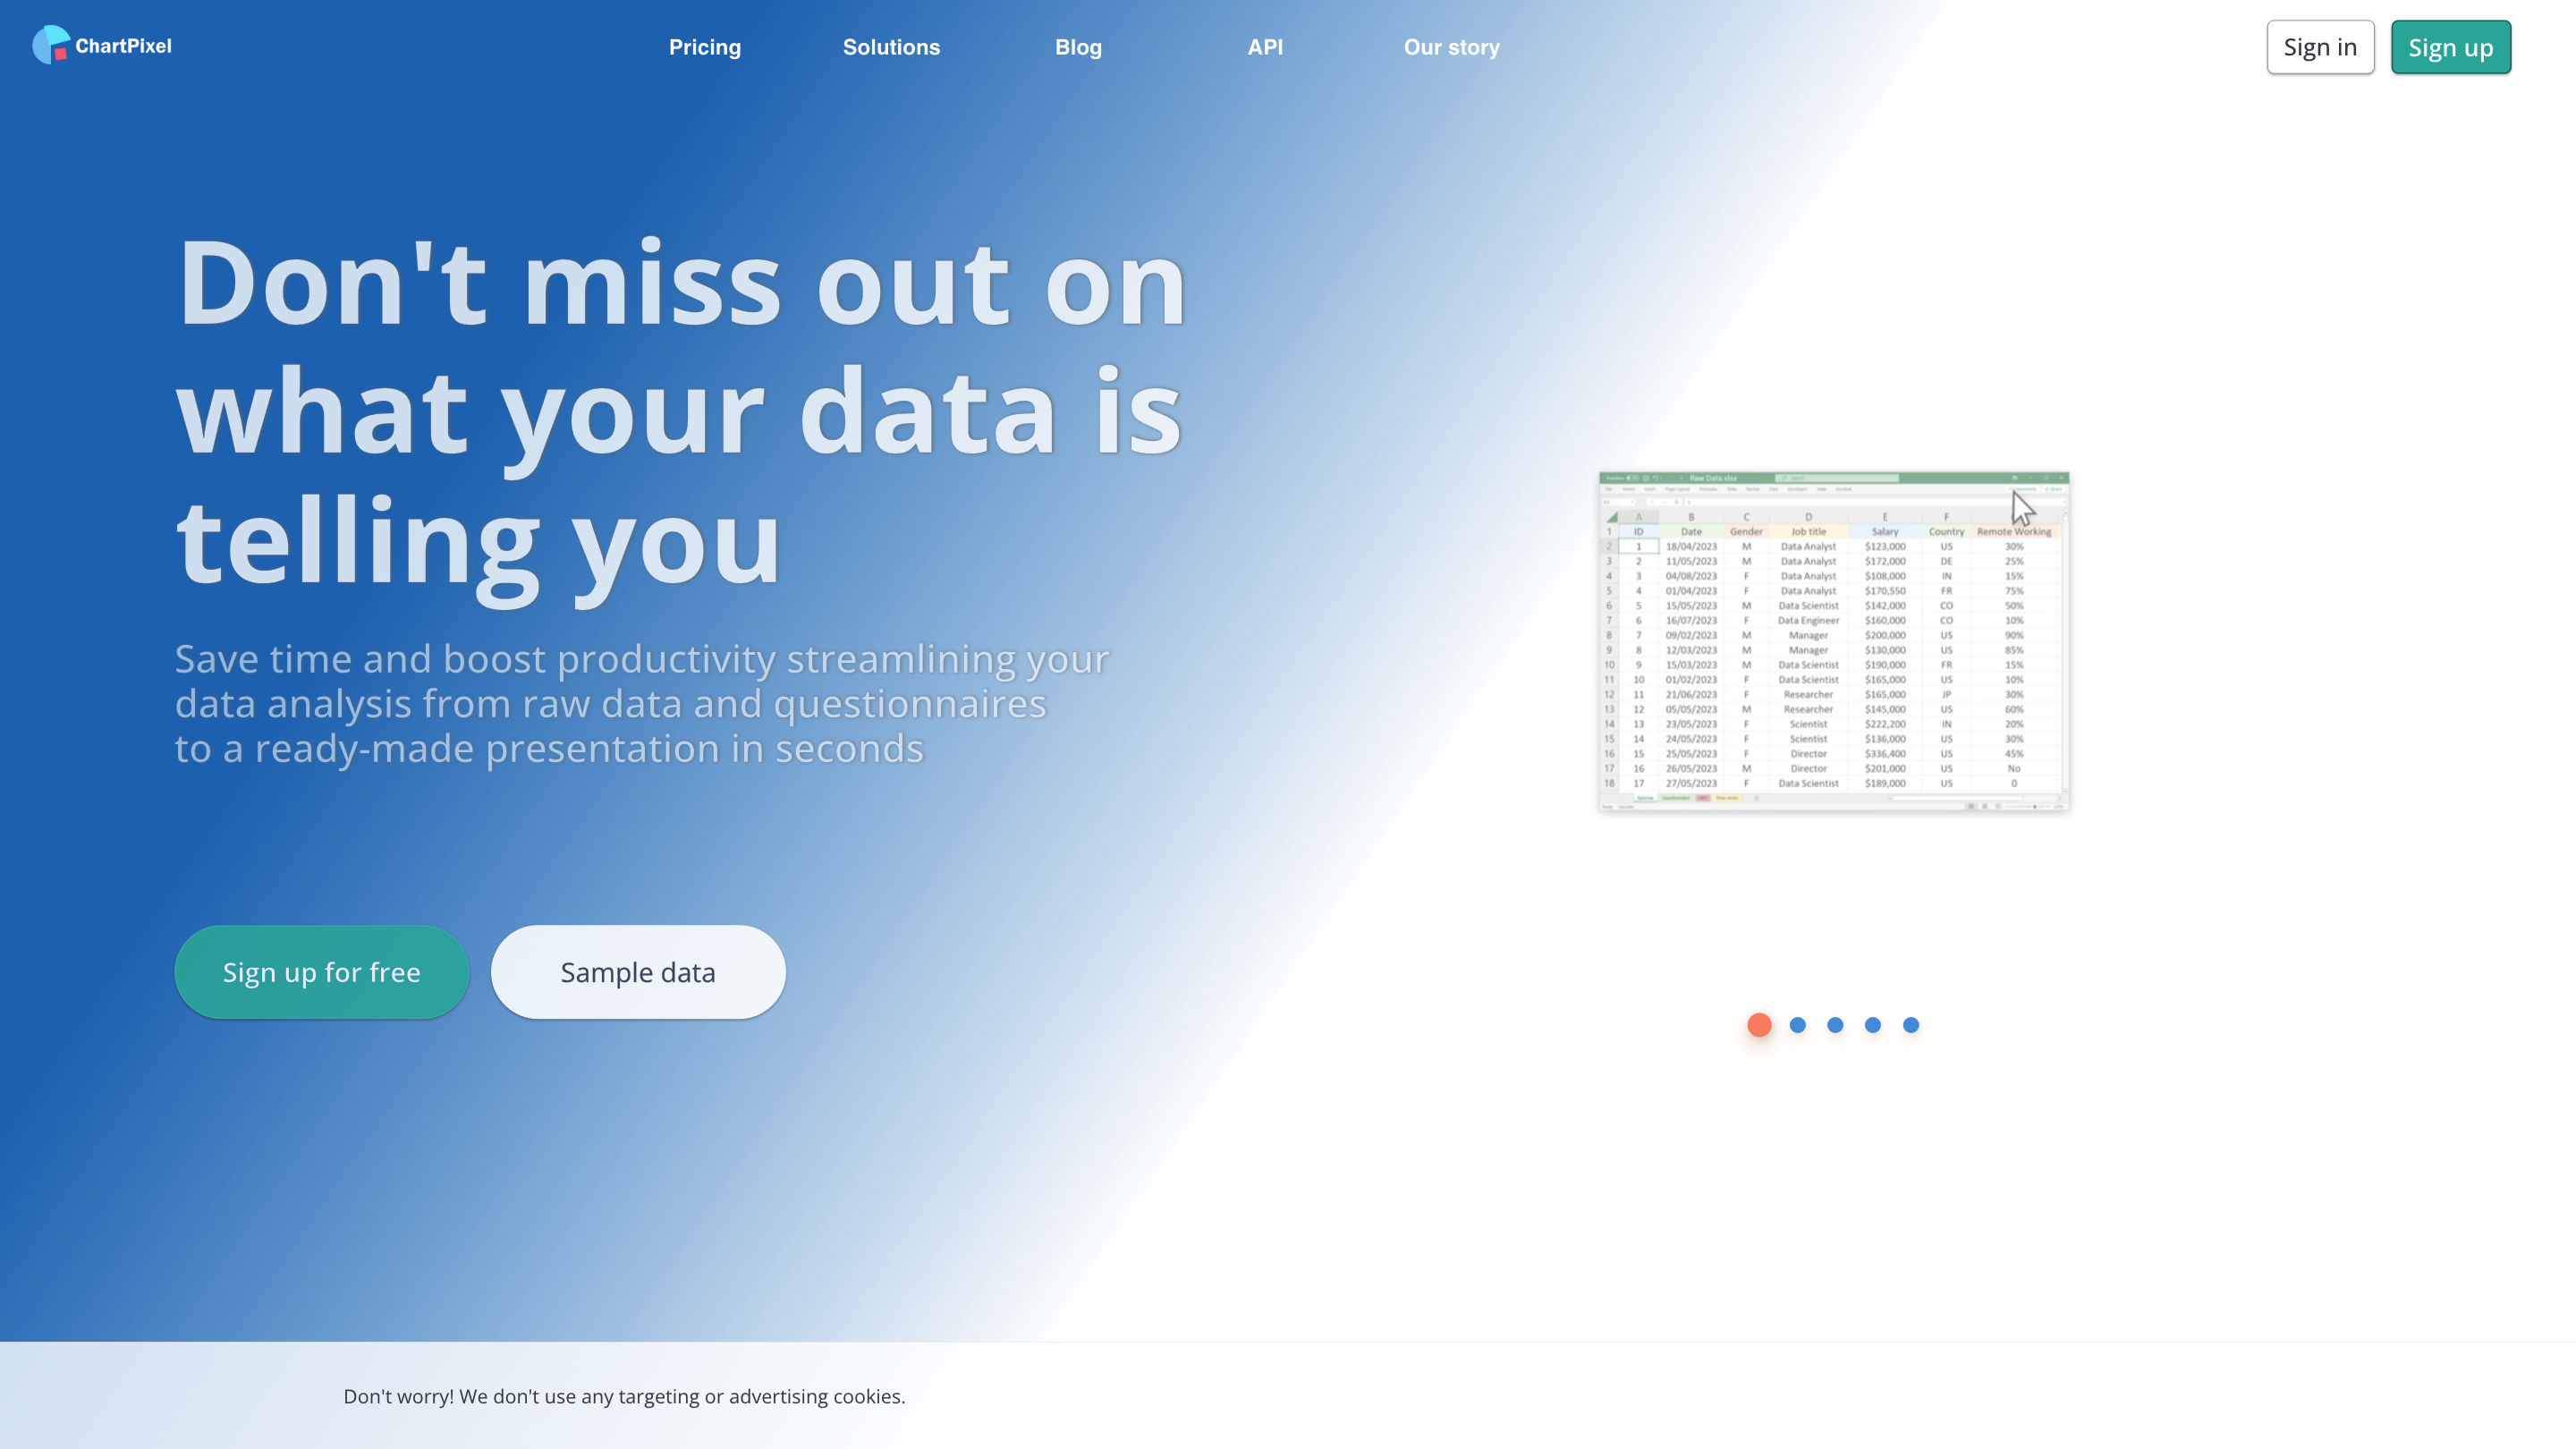
- Upload your data. Drag-and-drop Excel or CSV files (and other sources like website tables) to ingest data.
- AI-guided analysis. The AI recommends charts, cleans data, fills in gaps, and constructs meaningful features automatically.
- Explore and interpret. Get AI-generated written insights, descriptive statistics, forecasts, and explanations to accompany visuals.
- Export and share. Export charts and insights to PowerPoint, embed or share projects via a link, and present findings with ease.
ChartPixel blends statistical rigor with user-friendly visuals, helping you learn what your data means without needing coding or advanced analytics skills.
Key Features
- No-code AI-assisted data analysis and charting
- Automatic data cleaning, feature engineering, and handling of missing values
- AI-generated written insights, descriptions, and takeaways backed by statistics
- A wide range of chart types (charts, maps, animations, scatter plots, etc.) with smart defaults
- One-click forecasts and statistical tests
- Guided data exploration mode to help choose relevant columns
- Country-aware smart maps and location-based visualizations
- Auto-suggested titles, labels, colors, and formatting for charts
- AI-driven data storytelling to accompany visuals
- Export charts and insights to PowerPoint for presentations
- Shareable project links and embeddable charts
- Data security: no training on your data; no raw data sent to external LLMs
Use Cases
- Researchers and students analyzing surveys, questionnaires, or panel data
- Business analysts exploring financial, sales, or operational datasets
- Journalists and editors visualizing data-driven stories
- Teams needing quick, presentable visuals and forecasts without coding
Safety and Privacy Considerations
- Data is not used to train external models, and there is an emphasis on secure handling of uploaded data.
Core Benefits
- Intuitive, AI-assisted data interpretation that accelerates insight generation
- Rich visualization options with clear explanations and forecasts
- Easy collaboration through sharable links and PowerPoint exports
- Suitable for both beginners and experienced analysts seeking rapid, reliable insights