Chat2CSV
Open siteResearch & Data Analysis
Introduction
Chat2CSV is a user-friendly tool for turning CSV files into charts using natural language commands.
Chat2CSV Product Information
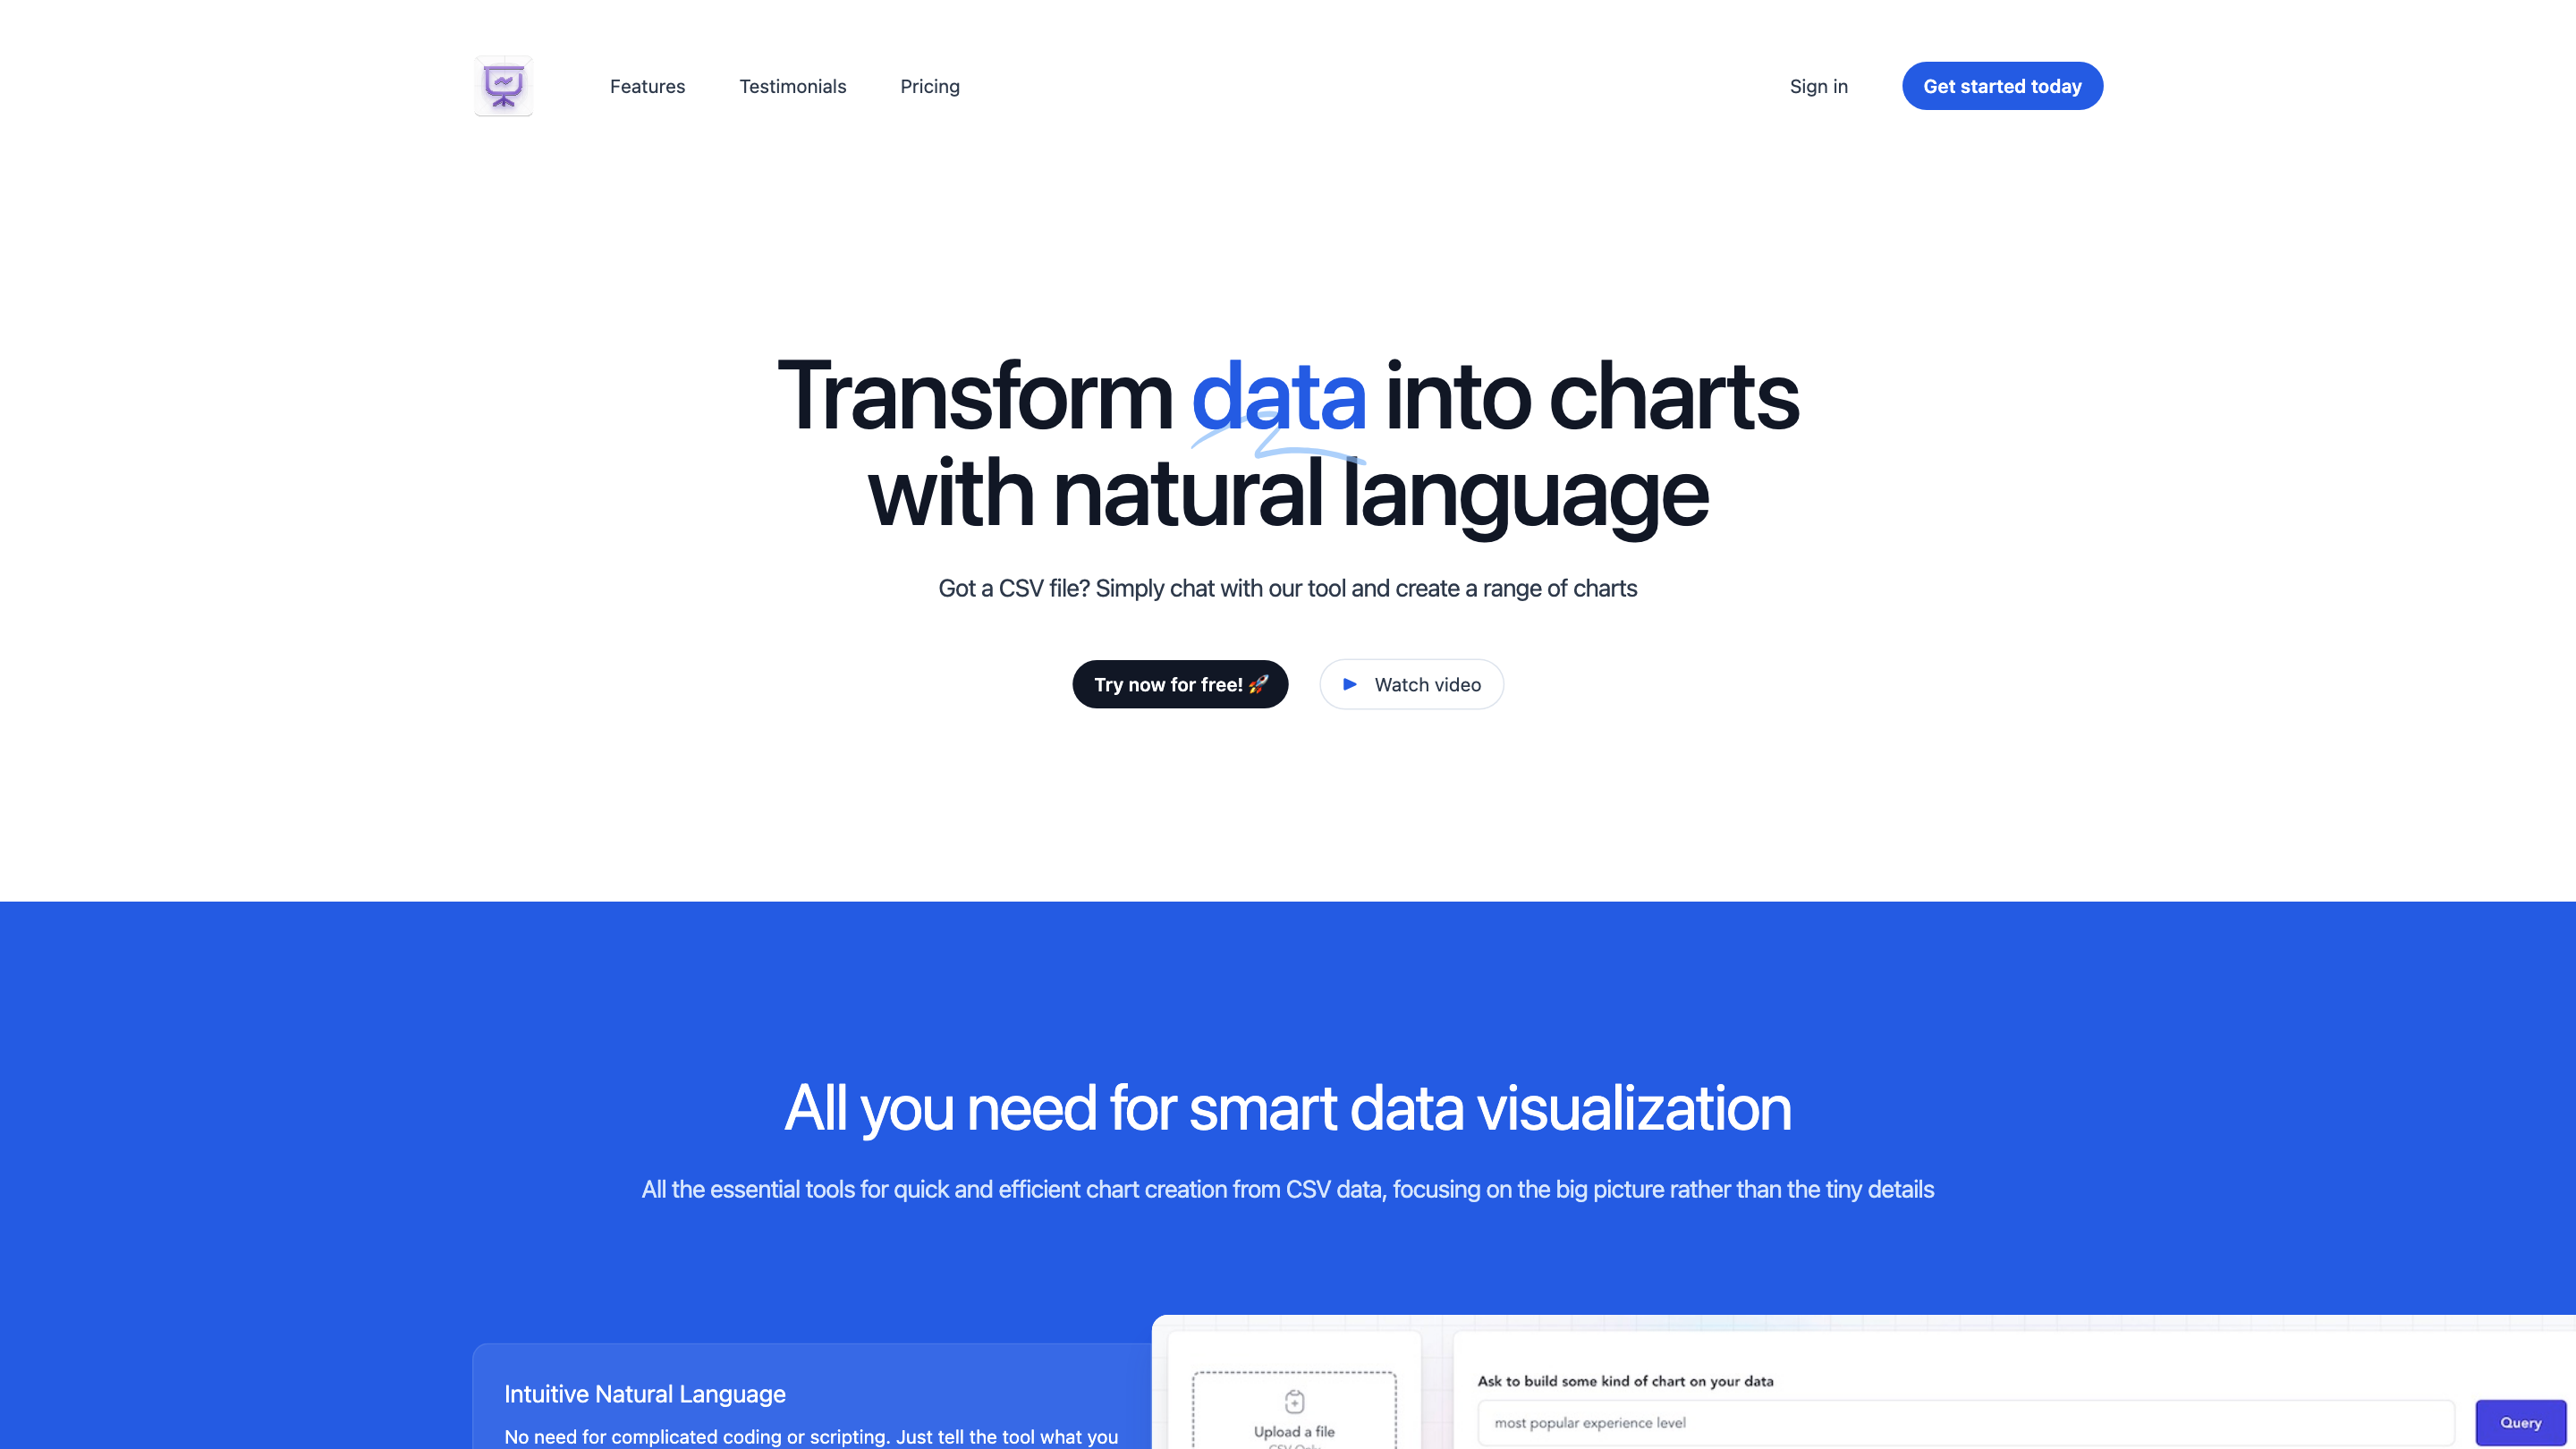
Easy Data Visualization with Natural Language | Chat2CSV is a no-code data visualization tool that lets you transform CSV data into a wide range of charts using plain English. Simply chat with the tool to generate charts, get AI-backed chart suggestions, and visualize data without programming. The platform emphasizes simplicity, data privacy, and quick insights from CSV data.
How it works
- Upload a CSV file (headers required).
- Describe the chart you want in natural language (e.g., "create a bar chart of sales by region").
- The AI suggests suitable chart types and renders the visualization. You can iterate with further natural language prompts.
Why users love it
- Intuitive Natural Language: No coding or scripting required; just describe what you want.
- Smart AI Support: The AI suggests the best chart types to maximize insights.
- Wide Variety of Charts: Bar, line, pie, scatter, and more, with options to tailor visuals to your data.
- Privacy-focused: Only metadata is processed on servers; your actual CSV data stays on your side.
- Quick, accessible visual storytelling for data analysis and decision-making.
How to use
- Click "Try now for free" or upload a CSV file.
- Type your chart request in plain English.
- Review the generated chart and refine with additional natural language prompts.
Features
- Natural language chart creation to avoid coding
- AI-driven chart type suggestions
- Support for multiple chart types (line, bar, pie, scatter, etc.)
- CSV upload with header parsing (data stays on user side)
- Free access with basic usage limits
- Future premium plan with added features (personal dashboard, secure storage, chart history)
What you can visualize
- Sales by region, inventory levels, trend analysis, product performance, and other CSV-driven metrics. The AI helps select the best visualization type for your data and insights.
Safety and privacy considerations
- Data stays on your side; only metadata is processed on servers.
- No coding required; straightforward natural language prompts.
Pricing (as described)
- Free Access: Basic features with minor daily limitations
- Premium Plan (Coming Soon): Enhanced features such as secure storage, chart history, multiple CSV files support, higher file size limits, and more AI prompts per file
Getting started
- Visit the platform, upload a CSV file, and start describing the chart you want in plain English. The AI will propose chart types and render visuals accordingly.
Note: This tool is designed to simplify data visualization tasks and make data analysis feel like a breeze by removing the need to code while keeping data security and ease of use at the forefront.
