Hex
Open siteResearch & Data Analysis
Introduction
Modern data platform for collaborative analytics.
Hex Product Information
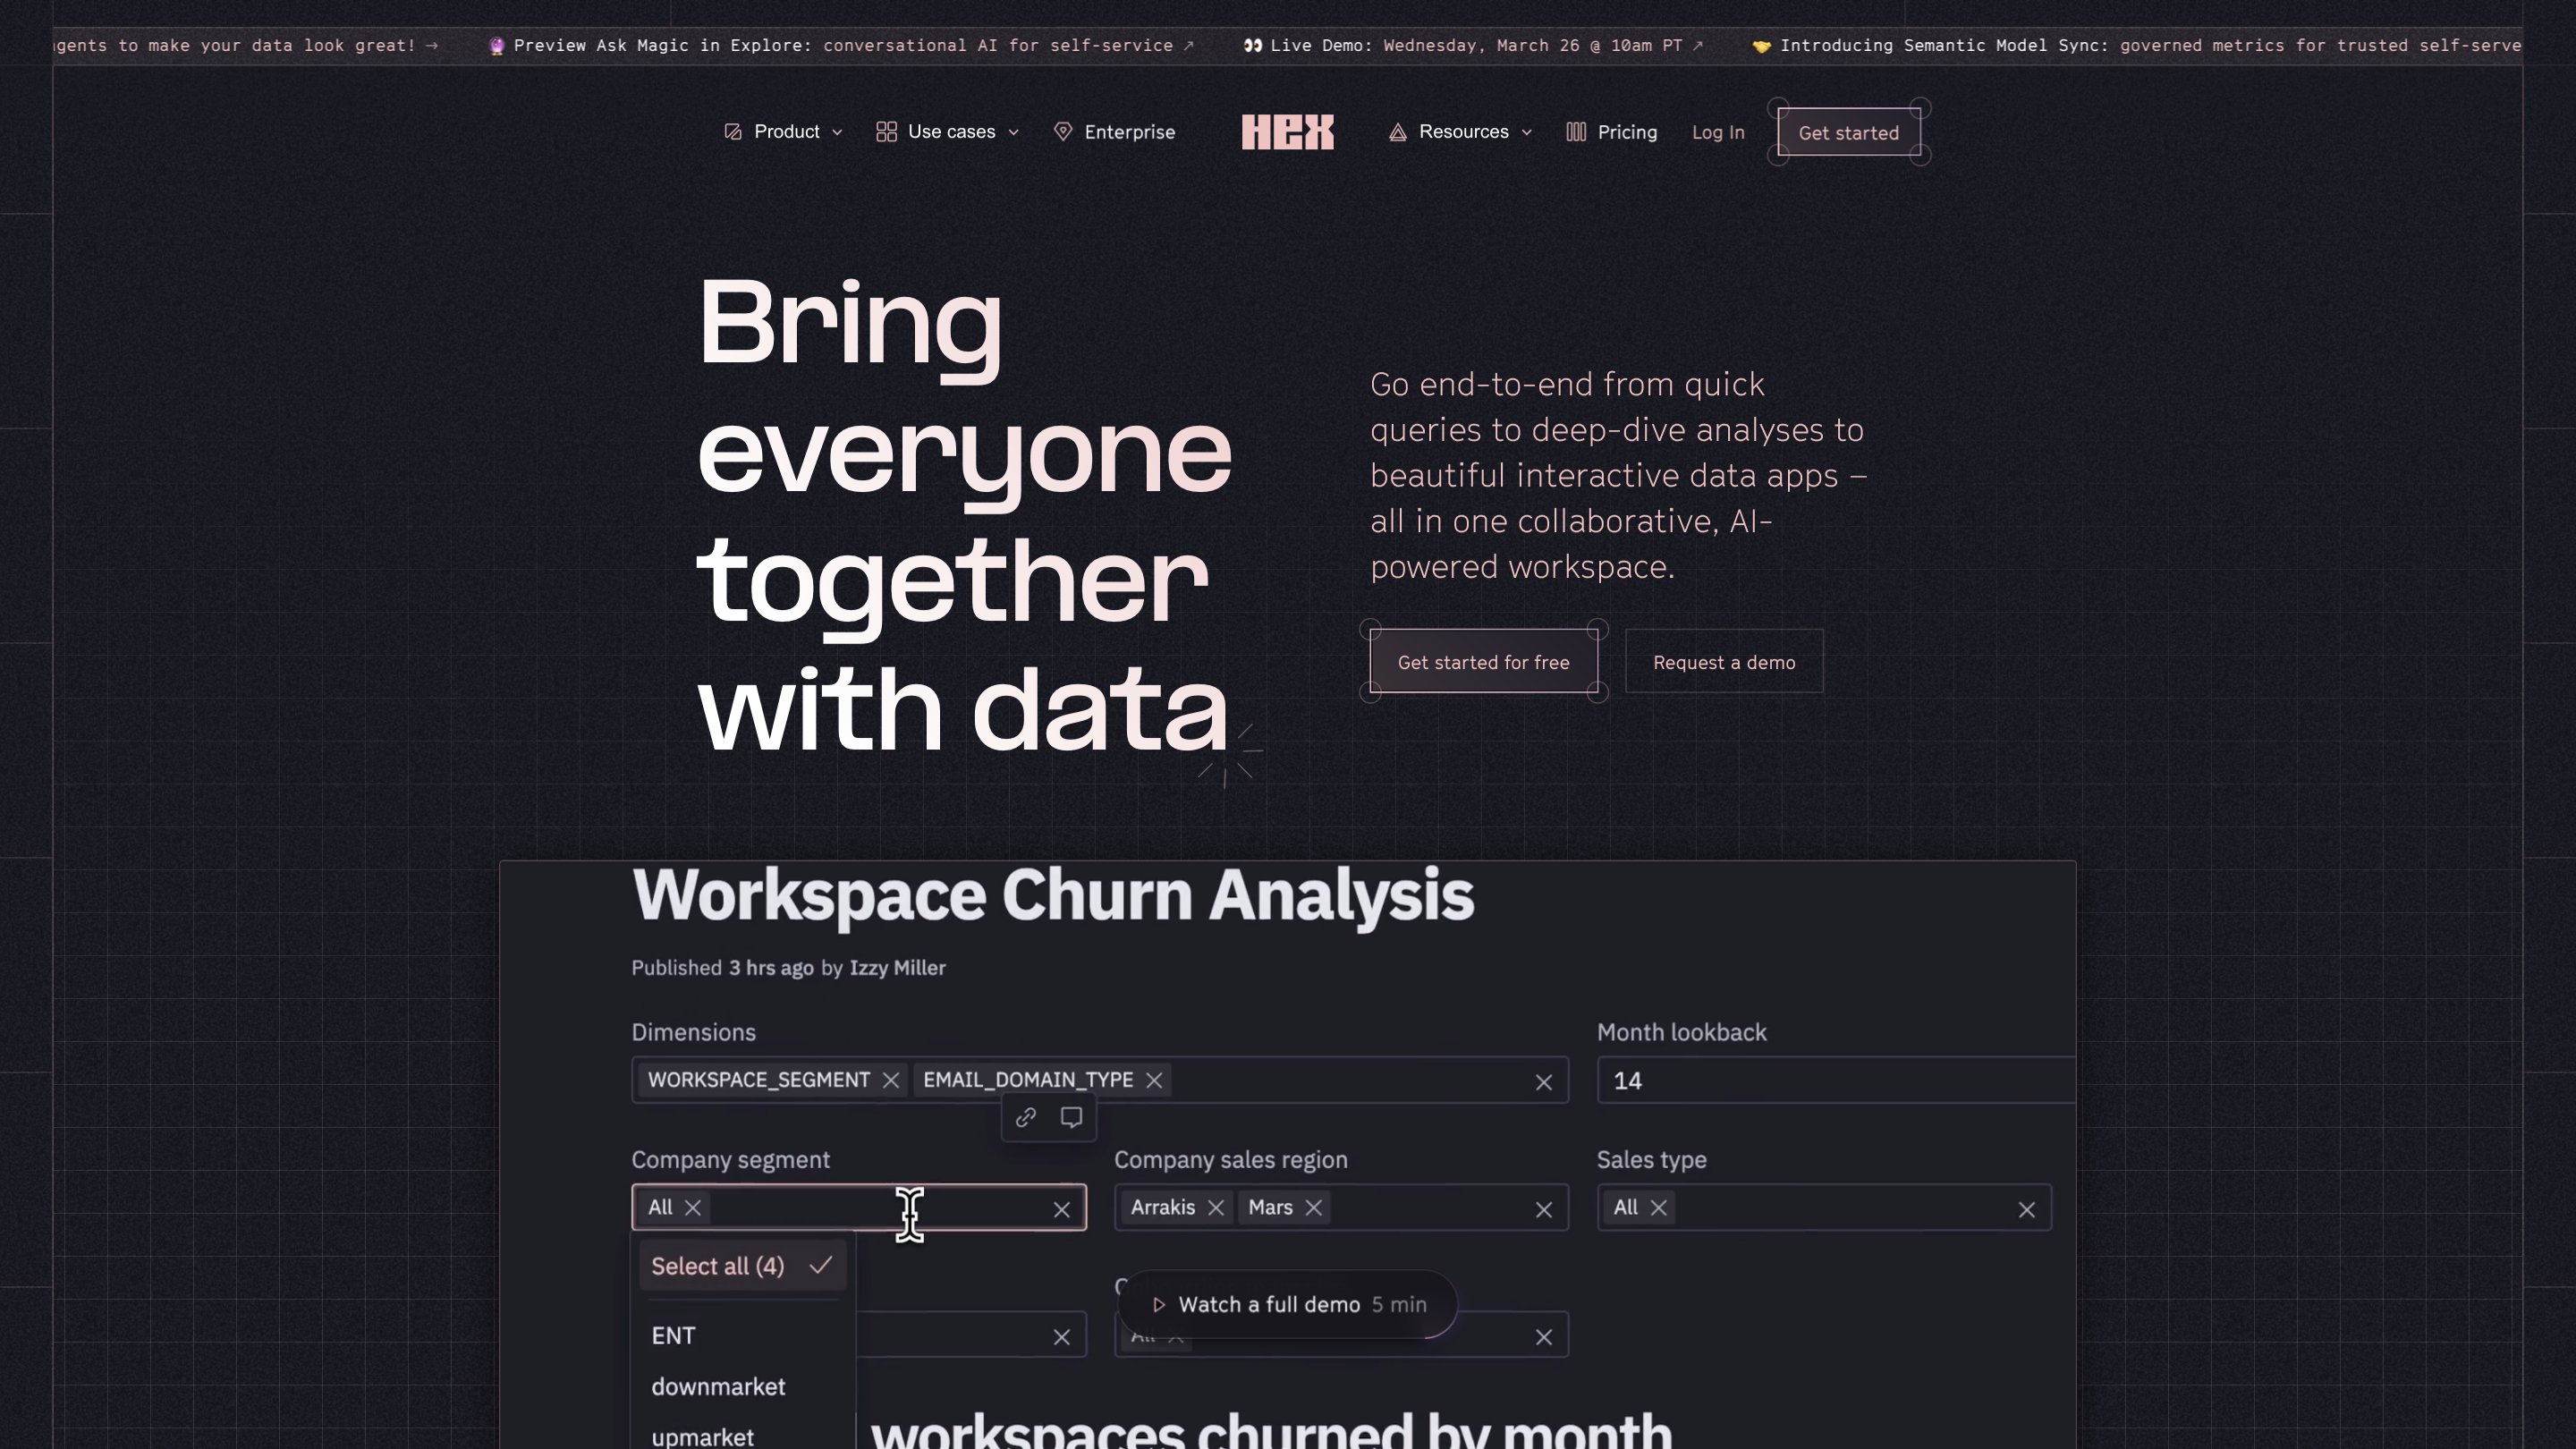
Hex: Magic data workspace for AI-powered data analysis
Hex is an AI-powered collaborative data workspace designed to bring everyone together to explore, model, analyze, and visualize data end-to-end. It combines notebooks, AI-assisted analysis, interactive apps, and a rich data app builder in one platform, with native integrations to popular data warehouses and ecosystems. The goal is to enable fast, scalable, no-code/low-code data exploration for both technical and non-technical users, while providing robust governance and security for teams.
How Hex helps teams
- Analyze, model, and explore data in a single collaborative workspace
- No/low-code data exploration with powerful AI-assisted capabilities
- Build and share interactive visualizations, dashboards, and data apps
- Integrate with existing data stacks through out-of-the-box connectors and APIs
- Collaborate with peers on notebooks, dashboards, and projects
How to Use Hex
- Connect your data: Link Hex to your data warehouse or data lake (e.g., Snowflake, BigQuery, Redshift, Trino, Databricks, etc.).
- Explore with Notebooks: Use SQL, Python, R, pivots, and spreadsheets inside a notebook-based canvas to explore data. Generate queries, write code, create visualizations, fix issues, and start analyses with natural prompts via Magic AI.
- Leverage Magic AI: Use AI-assisted prompts to generate queries, write code, or create visualizations without leaving the platform.
- Collaborate: Share work, collect feedback, review diffs, and reuse components across projects.
- Publish & Share: Turn insights into interactive reports, data apps, and dashboards with a drag-and-drop app builder.
Core Capabilities
- End-to-end data workspace: notebooks, AI tools, collaboration, and app builder in one place
- SQL, Python, R, pivots, spreadsheets, and charts unified in a modular canvas
- Magic AI for code generation, query building, visualization, and debugging from prompts
- Notebooks for exploratory data analysis and rapid experimentation
- App Builder for interactive data apps and dashboards
- Collaboration features to share work, solicit feedback, and build from reusable components
- Out-of-the-box connections to major warehouses and databases; secure, scalable data connections
- Deep integration with dbt for data modeling and metadata enrichment
- Python support via Snowpark/Spark integration and remote execution (when available)
- Code export/import to Git repositories for auditability and versioning
- Enterprise-grade security and flexible deployment options (SOC2, HIPAA, etc.)
- Rich templates and pre-built templates for common data tasks (clustering, time series, NLP, dashboards, etc.)
Notable Features (Overview)
- Notebooks: Analyze, model, and explore with a familiar, notebook-based canvas
- Magic AI: Generate queries, write code, fix bugs, and kickstart analyses from prompts
- Collaboration: Real-time collaboration, feedback loops, and diff reviews
- App Builder: Build and share interactive data apps without heavy coding
- Integrations: Built-in connections to data warehouses and lakehouses; APIs for custom integrations
- Security: Enterprise-grade security and flexible deployment models including single-tenant and private cloud
- Templates: Pre-built templates for data science, exploratory analysis, dashboards, NLP, and more
Use Cases
- Exploratory analysis and rapid data discovery
- Data science projects and operational analytics
- Self-serve analytics for business stakeholders
- Collaborative data product development and data apps
Getting Started
- Connect to your data warehouse
- Create a new project/notebook
- Use Magic AI to accelerate queries and visualizations
- Build dashboards or data apps and share with your team
Safety and Governance
- Secure data connections and access controls
- Versioning and audit trails via Git integration
- Compliance-friendly deployment options for enterprise customers
Related Terms and Concepts
- Data exploration, data science, and operational analytics within a single workspace
- No-code/low-code data analysis with AI assistance
- Data modeling with dbt integration
- Data visualization and interactive data apps
Example Workflows
- Quick query generation: Prompt Magic AI to generate a SQL query for a time-series KPI, refine in notebook, and visualize results in a dashboard.
- Data modeling: Use dbt integration to enrich schemas, then profile data with built-in templates and create a KPI dashboard.
- Collaborative analysis: Share notebooks and dashboards with teammates, review changes, and publish a data app for stakeholders.
Quick Reference (What Hex Offers)
- Notebooks for data exploration and modeling
- Magic AI for prompt-driven analysis
- Collaboration and diff reviews
- App Builder for interactive dashboards
- Pre-built templates for common analytics tasks
- Rich integrations with data warehouses, dbt, and other tools
- Enterprise security and deployment options
Where to Learn More
- Product docs, templates, and guides
- Community resources and customer stories
- Changelog and release notes for new features
Key Benefits
- Unified, end-to-end data workspace that accelerates insight generation
- Accessible to both data professionals and stakeholders through AI-assisted workflows
- Scalable, secure, and governance-friendly for teams of all sizes
Taggable Feature Areas
- Notebooks-based exploration
- Magic AI assistance
- Collaboration and versioning
- App Builder for data apps
- Data warehouse integrations
- dbt integration
- Security and deployment options
- Templates for common analytics tasks