NativeBI
Open siteResearch & Data Analysis
Introduction
NativeBI is a platform that allows business leaders to access and analyze data easily.
NativeBI Product Information
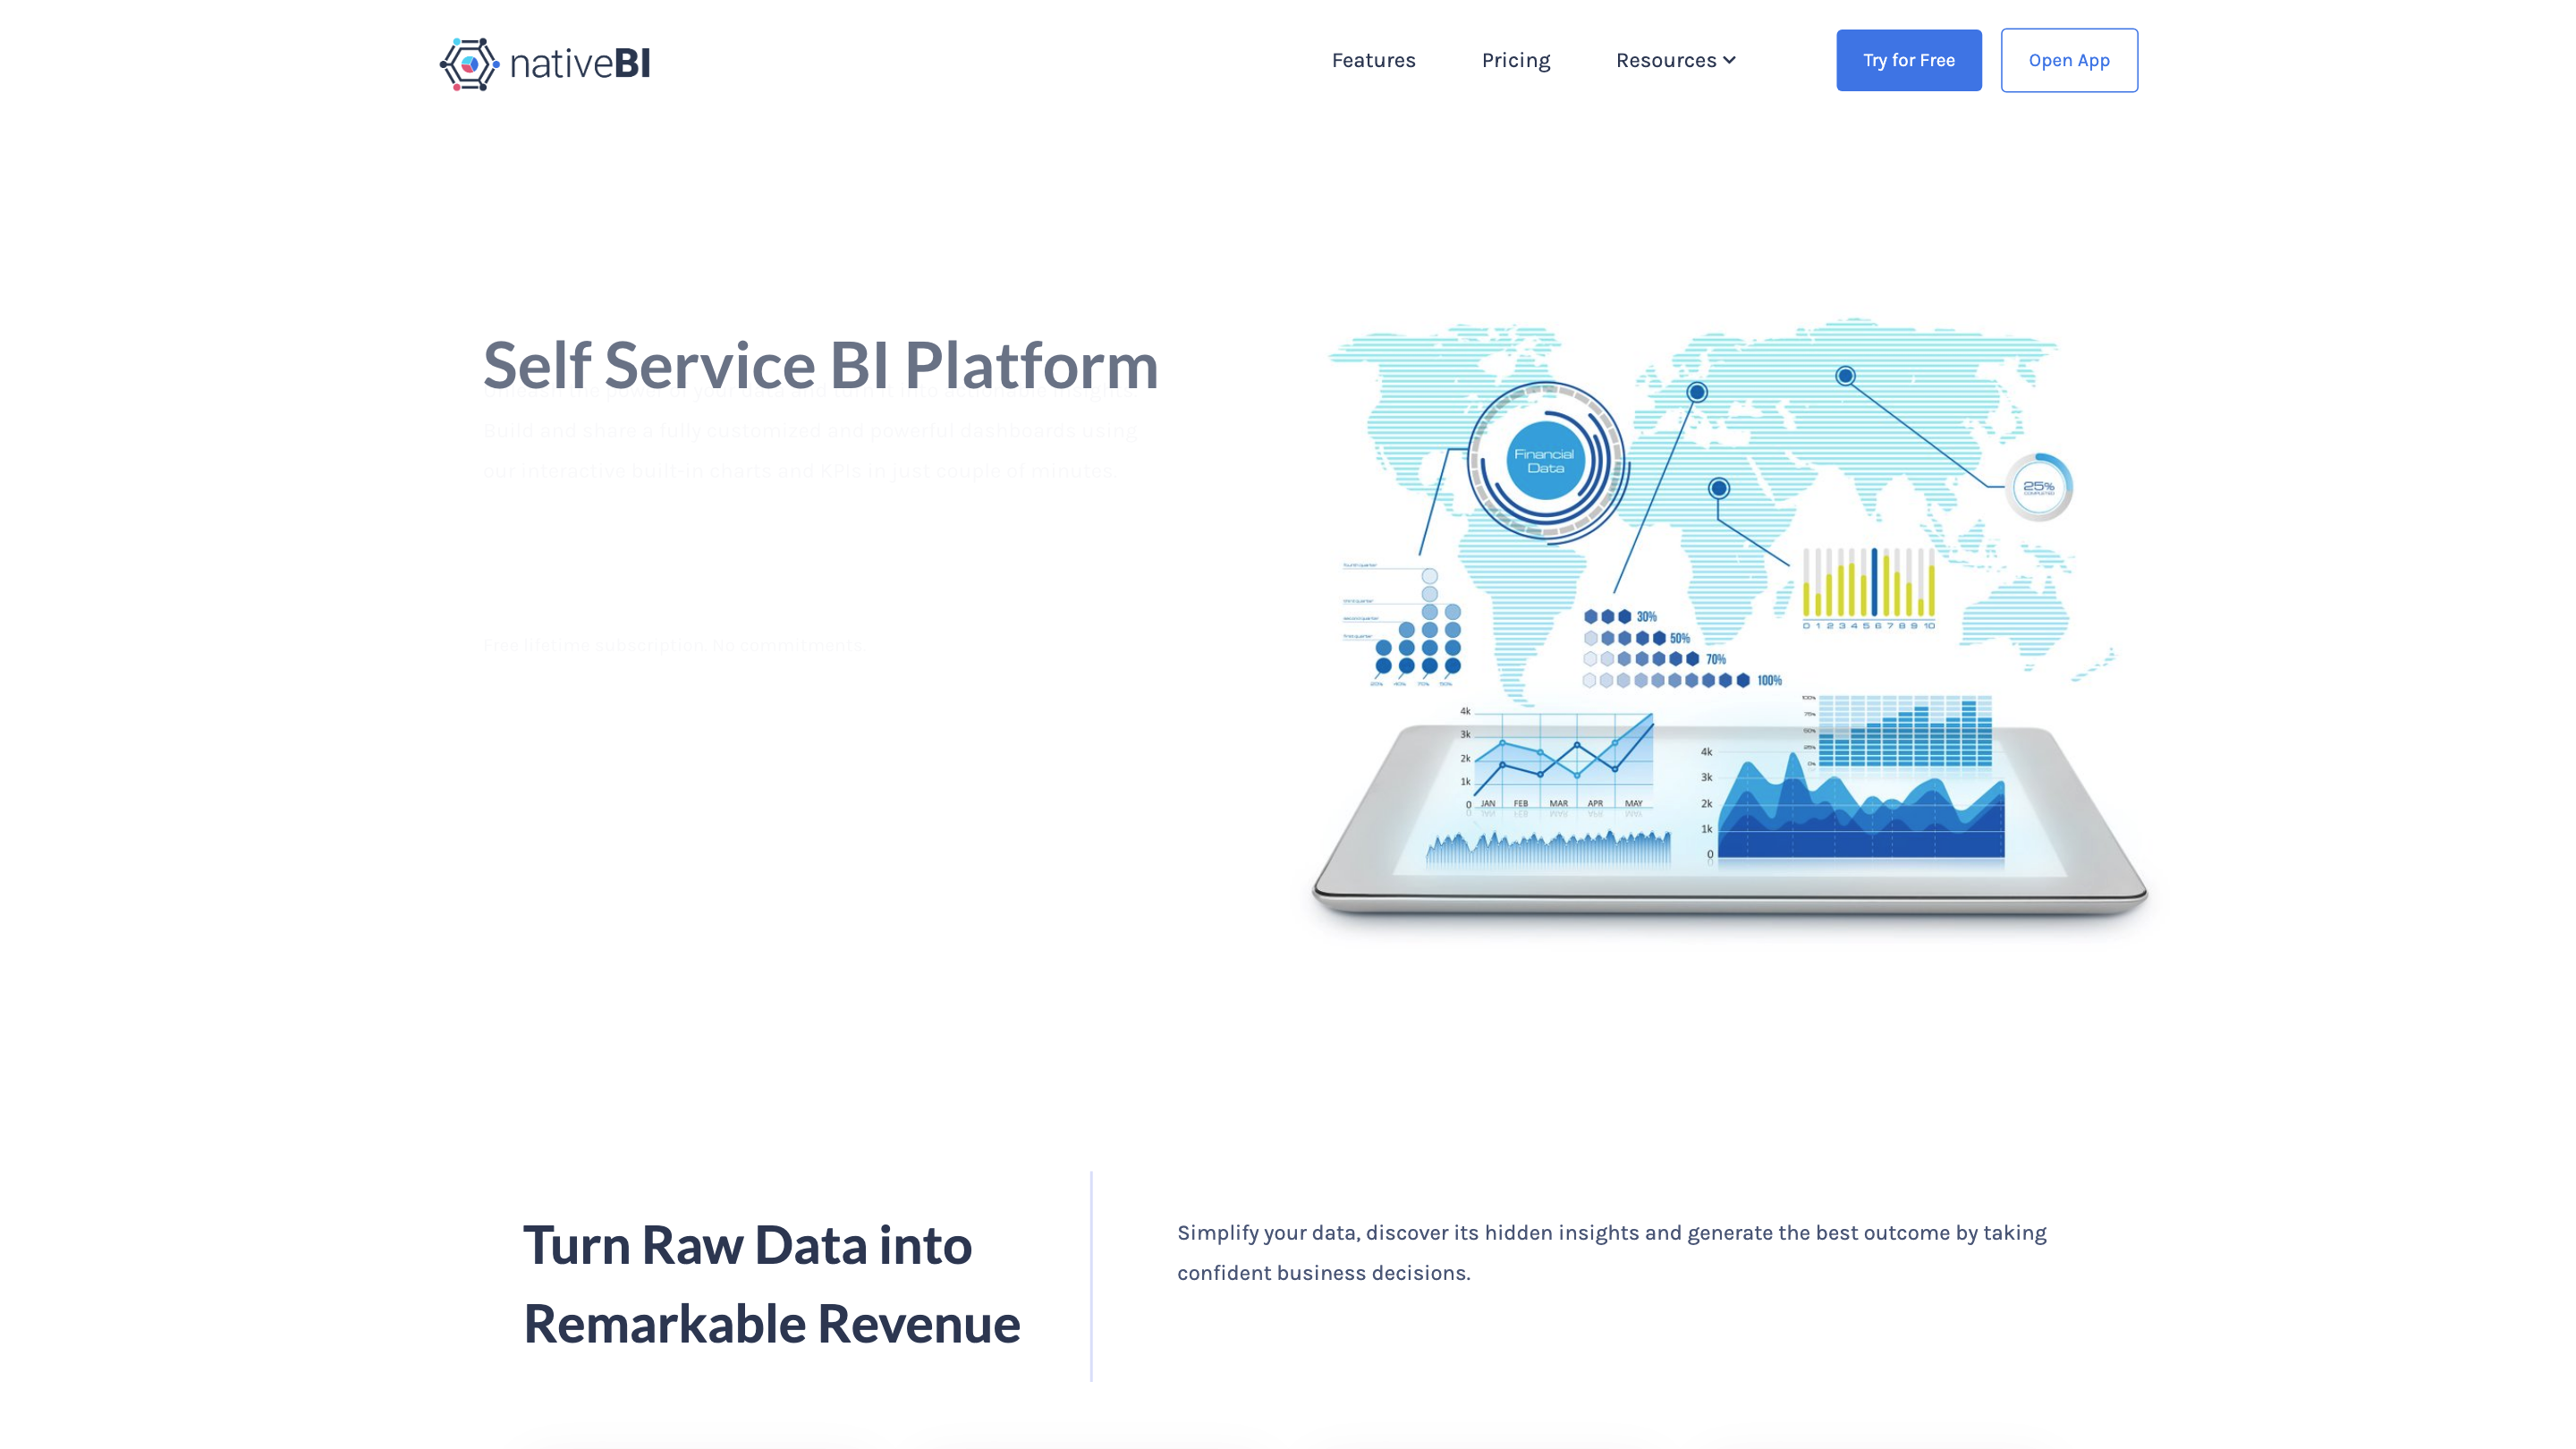
NativeBI Self-Service BI Platform is a self-service business intelligence solution that empowers business leaders to visualize, study, and analyze data through interactive dashboards and KPIs. It enables rapid creation of fully customized dashboards with built-in charts and analytics to turn raw data into actionable insights for informed decision-making.
How it works
- Connect to data sources. NativeBI integrates with major relational databases, spreadsheets, REST APIs, and cloud data sources.
- Build dashboards and reports. Create interactive, responsive dashboards that read up-to-date data from multiple sources.
- Generate insights. Use a ChatGPT-like interface to perform ad-hoc analysis and uncover actionable insights.
- Get notifications. Define custom rules to be alerted when data changes or when specific conditions are met.
- Collaborate securely. Share dashboards and reports with team members to coordinate decision-making.
Core Capabilities
- Data Consolidation: Gather internal and external data sources in one place for unified analysis.
- Data Visualization: Interactive and responsive dashboards to reveal hidden values anywhere, anytime.
- Ad-hoc ChatGPT Analysis: Natural language analysis powered by an AI model to generate insights.
- Team Collaboration: Secure sharing and collaboration on dashboards and reports.
- Live Data Connectivity: Dashboards read live data from multiple sources for up-to-date insights.
- Seamless Integration: Smart data extraction engine for smooth data source integration.
- Data Centralization: Treat all data sources as a single source with consistent structure.
- Notifications & Alerts: Custom business rules to monitor data changes and trigger alerts.
- Flexible Subscriptions: Plans to fit startups to large enterprises, with options for customization and on-prem deployments.
- Easy Customization: Scalable architecture enabling complex client customizations at low cost.
- Unlimited Viewers: Allow an unrestricted number of users to view dashboards and reports.
- Ready-to-use Templates: Pre-built templates and widgets to accelerate dashboard development.
How to Use NativeBI
- Connect data sources. Link databases, spreadsheets, APIs, and cloud sources.
- Create dashboards. Drag-and-drop widgets to visualize metrics and KPIs.
- Analyze with AI. Use natural language queries to get insights via the built-in ChatGPT-like interface.
- Share and collaborate. Invite teammates to view or edit dashboards securely.
What Is NativeBI?
NativeBI is a powerful self-service BI platform designed to help business leaders visualize, study, and analyze all organizational data in one place through interactive dashboards and KPIs. It emphasizes ease of use, real-time data access, and secure collaboration across teams.
Safety and Legal Considerations
- Ensure proper data governance when integrating multiple sources and sharing dashboards. Respect data privacy and access controls.
Core Features
- Free lifetime subscription with no commitment (try for free)
- Connect to multiple data sources (databases, spreadsheets, APIs, cloud sources)
- Build responsive, interactive dashboards and reports
- Ad-hoc analysis using natural language with AI assistance
- Live data read from multiple sources for up-to-date analytics
- Secure collaboration and unlimited viewers
- Custom notifications and business rules
- Flexible subscription plans and on-premise options
- Quick start with built-in charts and widgets
- Highly customizable and scalable architecture