Palzin Monitor
Open siteIntroduction
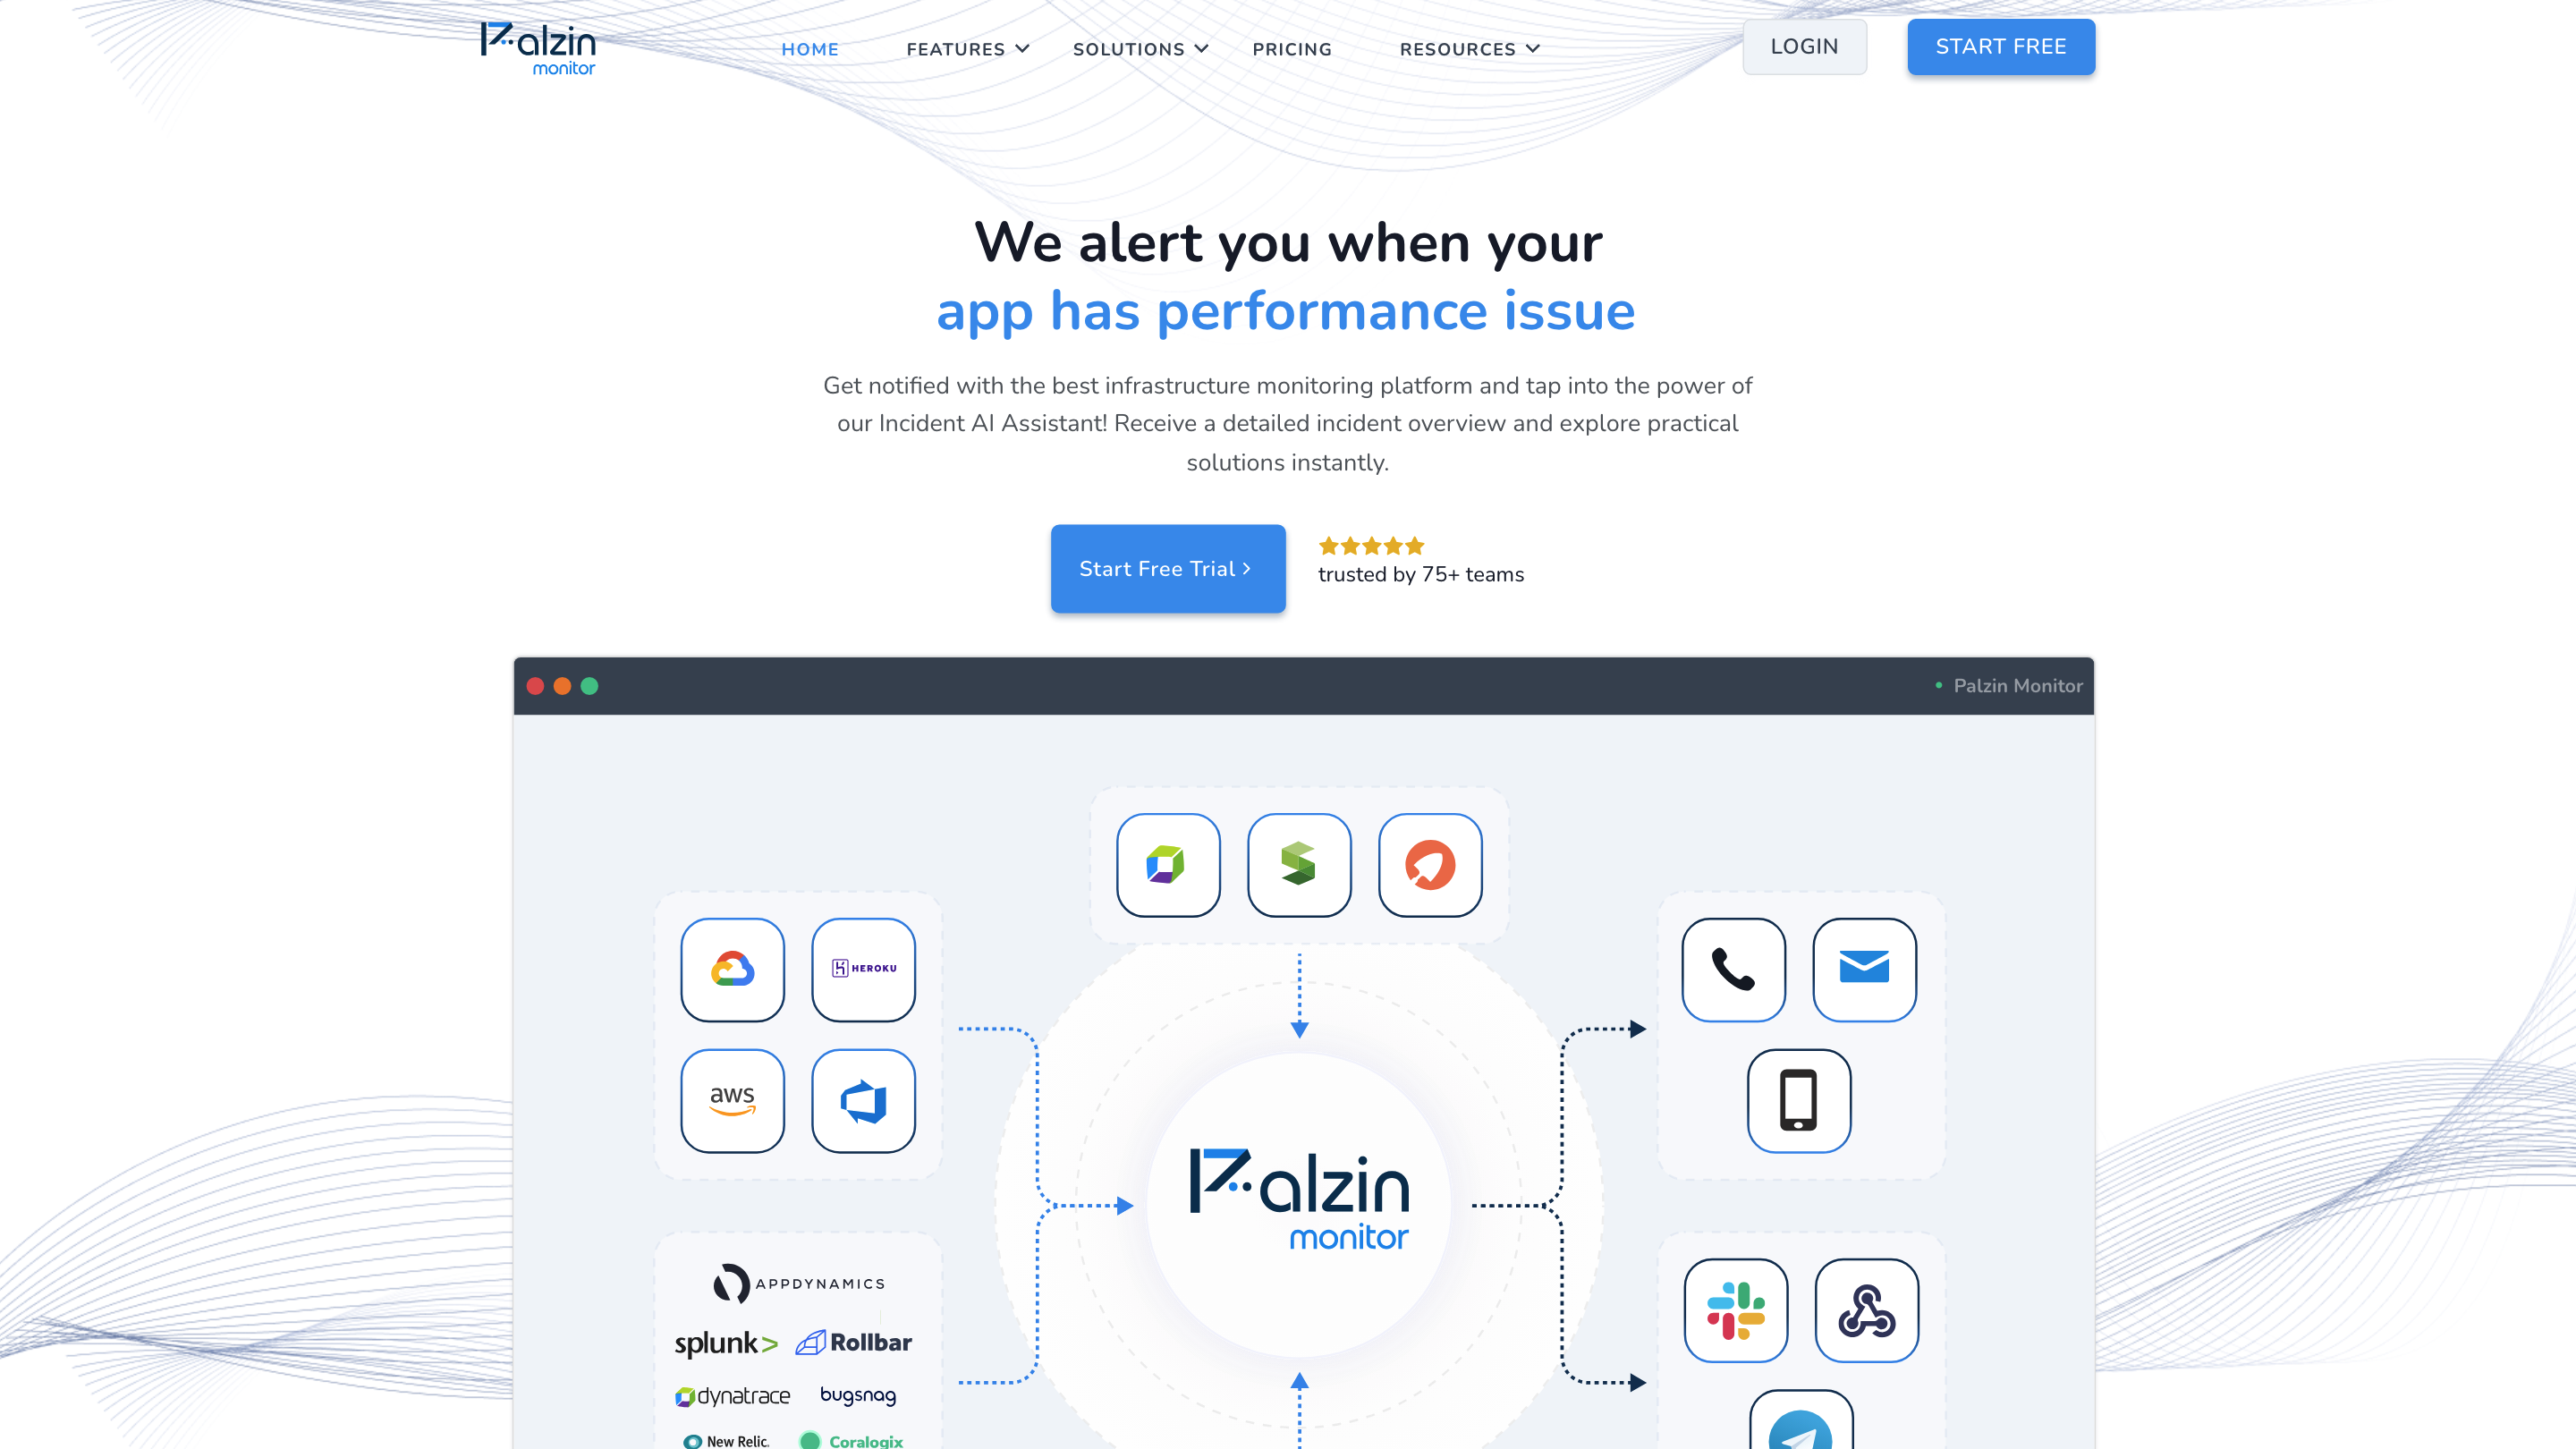
Simple, powerful, and smart monitoring platform with incident management and AI assistant.
Palzin Monitor Product Information
Palzin Monitor Overview
Palzin Monitor is a comprehensive infrastructure monitoring and incident management platform designed for software and DevOps teams. It offers a wide range of monitoring capabilities (uptime, network, DNS, SSL, keywords, ports, heartbeat, service integrations, and application performance) combined with incident management features, AI-assisted insights, and extensive integrations. The solution emphasizes proactive alerts, rapid incident resolution, and seamless collaboration through on-call scheduling, war rooms, postmortems, and AI-assisted incident analysis. It is suitable for teams across startups to enterprises and integrates with major monitoring and cloud tools.
How Palzin Monitor Works
- Monitor various aspects of your infrastructure and applications (HTTP/status codes, latency, DNS, SSL expiry, keywords, ports, cron jobs, and more).
- Receive real-time alerts and incident notifications via multiple channels (phone call, SMS, Slack, Microsoft Teams, email).
- Manage incidents end-to-end with triage, escalation policies, on-call rotations, and collaboration tools (war room, postmortems).
- Gain actionable insights with the Incident AI Assistant and application performance analytics.
Features
- Uptime Monitoring for HTTP and status codes to ensure application availability
- Ping Monitoring to track latency and packet loss across networks
- SSL Monitoring to alert before certificate expiration
- Keyword Monitoring to verify presence/absence of specific text on pages
- Port Monitoring to oversee critical services on specific ports
- Heartbeat Monitoring (Cron job monitoring) for scheduled tasks
- DNS Monitoring to detect DNS record issues and changes
- Incident Management for coordinated response and faster resolution
- Error Monitoring to identify and fix application errors with context
- Application Performance Monitoring (APM) to identify bottlenecks and optimize speed
- Services Monitoring to monitor 3rd-party and internal services
- Status Page Monitoring to communicate real-time health to users
- API/Third-Party Monitoring and integration capabilities
- Domain and Nameserver Change/Expiration Monitoring to protect domains
- On-call Scheduling to automate duty rotations
- War Room for collaborative incident resolution
- Postmortems with root cause analysis, cost estimates, and preventive actions
- No false positives through multi-location validation
- Incident AI Assistant for thorough incident overviews and practical solutions
- Mobile App support for on-the-go alerts
- Real-time, zero-code instrumentation for Application Performance Monitoring
- Auto-Discovery of Application Processes to identify resource-intensive components
- Execution Timeline for visualizing request flow and pinpointing optimization opportunities
- Performance Distribution to distinguish good vs. bad performance
- Error Context data capture (URL, user, version, user agent, etc.) to speed debugging
- Wide technology support (PHP, Laravel, Node.js, Symfony, CodeIgniter, Fastify, Express.js, Slim, and more)
- Seamless integrations with DataDog, New Relic, Grafana, Prometheus, Zabbix, AWS, Azure, Google Cloud, and more
Target Users & Benefits
- Software and DevOps teams seeking reliable uptime and proactive issue detection
- Organizations needing integrated incident response, collaboration, and post-incident analysis
- Teams requiring multi-channel alerting, on-call automation, and AI-assisted incident insights
How to Get Started
- Start a free trial to explore uptime, ping, SSL, and incident monitoring capabilities
- Configure monitoring for your website, APIs, and third-party services
- Set up alert channels, escalation policies, and on-call schedules
- Use Incident AI Assistant and War Room for rapid resolutions
About Palzin Monitor
Palzin Monitor is trusted by 75+ teams and built to scale from startups to global enterprises. It emphasizes early issue detection, quick remediation, and an integrated approach to monitoring, incident management, and collaboration.