SPSSAU
Open siteResearch & Data Analysis
Introduction
Web-based statistical analysis platform with AI tools.
SPSSAU Product Information
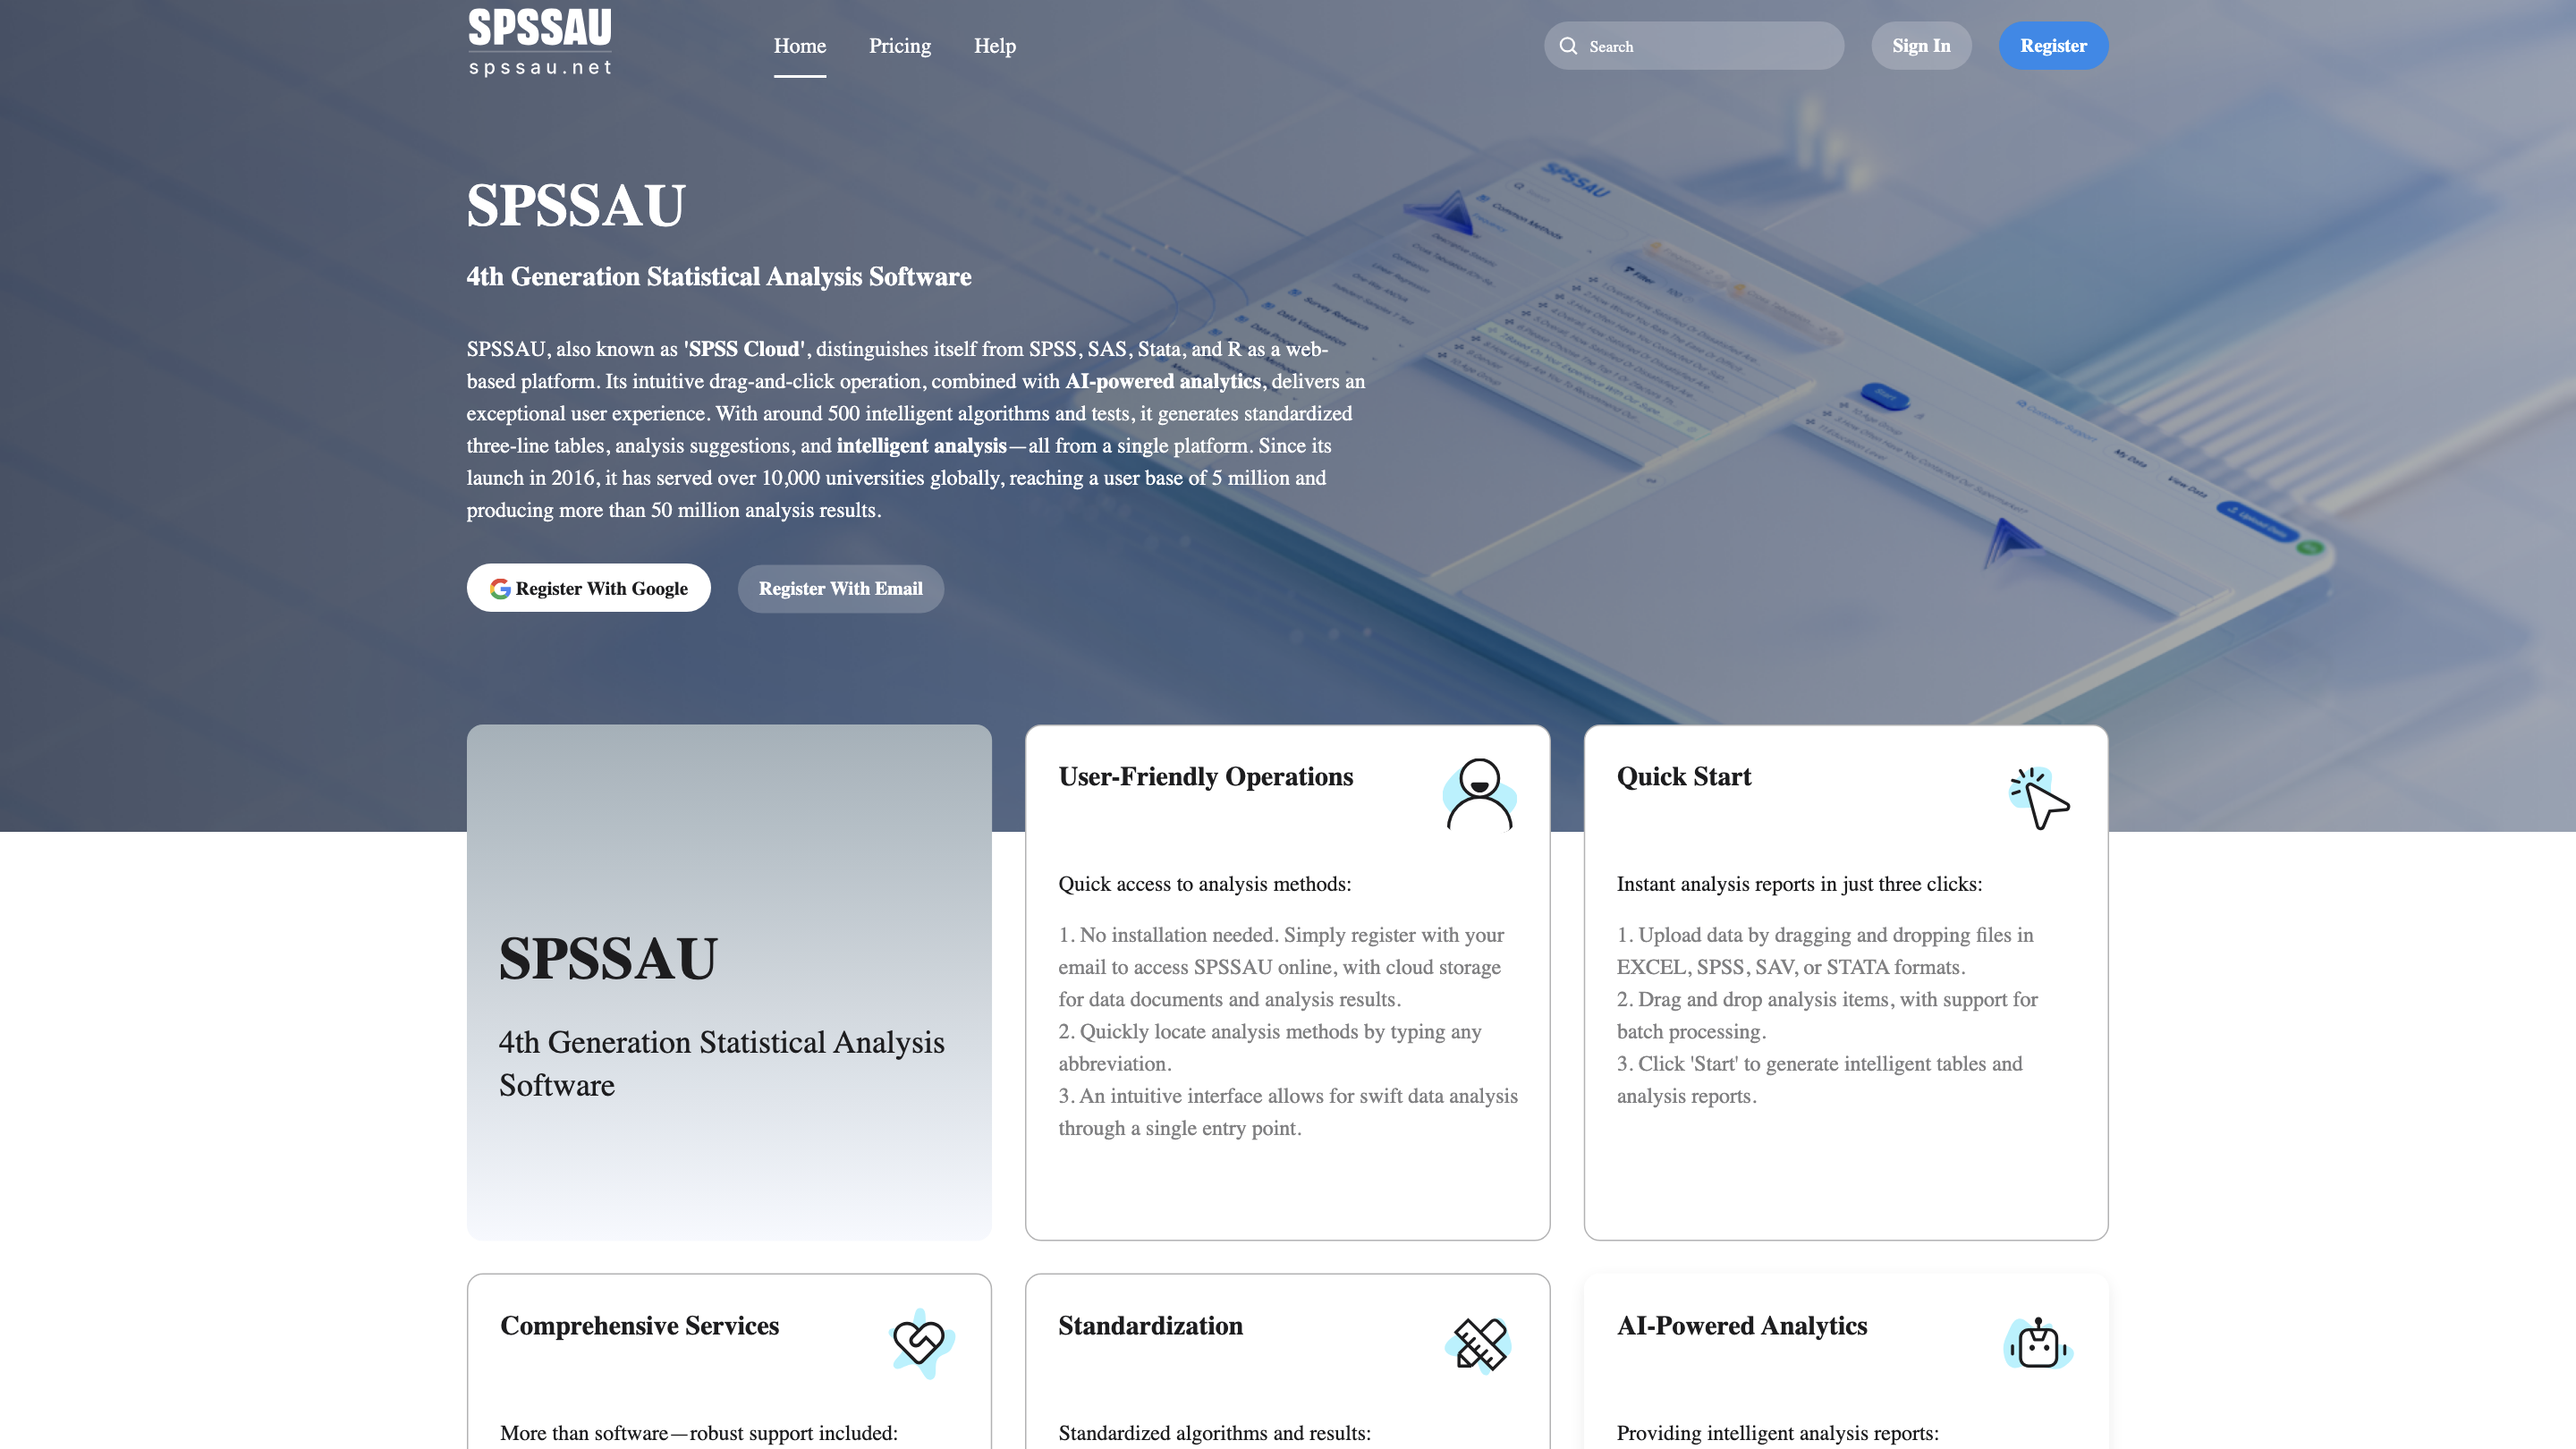
SPSSAU Cloud (SPSSAU 4th Generation Statistical Analysis Software) is a web-based platform that distinguishes itself from SPSS, SAS, Stata, and R by offering AI-powered analytics and a drag-and-click interface. Since its 2016 launch, it has served millions of users across thousands of universities and provides around 500 intelligent algorithms and tests, generating standardized three-line tables, analysis suggestions, and intelligent interpretations from a single platform.
Key Highlights
- Web-based, no local installation required: register with Google or Email to access cloud storage for data documents and results.
- AI-powered analytics and intuitive UI to streamline data analysis with a single entry point.
- Comprehensive toolset: 13 modules and about 500 methods covering a wide range of statistical and data analysis tasks.
- Generates ready-to-use outputs: standardized three-line tables, P-values, and visualizations suitable for academic reports.
- Strong emphasis on accessibility and speed: quick method search by abbreviation and three-click start for instant reports.
How to Use SPSSAU
- Register and sign in: Register with Google or Email to access the cloud environment and save results.
- Upload data: Drag-and-drop data files in formats such as EXCEL, SPSS, SAV, STATA (and compatible surveys data sources).
- Select analyses: Use the intuitive interface to drag and drop analysis items, with batch processing supported.
- Start analysis: Click to generate intelligent tables and reports; results are ready for export.
Core Capabilities
- Analysis automation: AI-generated interpretations and analysis suggestions to guide user decisions.
- Comprehensive suite: 13 analysis modules (ANOVA, regression, t-tests, correlation, chi-square, etc.) and 500 methods.
- Visualization: 14 types of statistical graphics automatically included in results; batch chart generation available.
- Output formats: export to PDF, Excel, Word; copy standardized tables directly into documents; one-click download of visuals.
- Data management: cloud storage with dual backups and easy data/document deletion; shareable links and privacy controls.
- 3-step data process: upload, analyze, export with guided workflows.
Modules and Methods (Representative Categories)
- Descriptive statistics, correlation, t-tests, ANOVA, regression (linear, logistic, etc.), chi-square.
- Advanced methods: CFA/SEM, factor analysis, PCA, cluster analysis, MANOVA, survival analysis, time-series, econometric techniques, ML-oriented methods (trees, SVM, etc.).
- Data processing tools: recoding, labeling, handling missing data, data cleaning, and variable transformations.
- Visualization: a wide range of plots including scatter, box, histogram, ROC, and more.
AI-Powered Analytics & Outputs
- AI-driven interpretations focus on results and recommendations rather than specialized terminology.
- Standardized three-line tables and visualizations are generated by default for straightforward reporting.
- One-click copy/export to integrate results into documents and presentations.
Data Security & Privacy
- Cloud storage with backups and straightforward data/document deletion.
- One-click removal of all data upon account cancellation.
Safety and Compliance
- Suitable for research and educational purposes; ensure proper data handling and compliance with institutional policies when sharing results.
Core Features
- Web-based, cloud-accessible analytics with no local installation
- AI-powered analytics and intelligent interpretations
- 13 modules and ~500 methods covering a broad spectrum of statistics and data analysis
- Standardized three-line tables and ready-to-use visualizations
- Drag-and-drop interface with quick method search and batch processing
- Data storage, sharing, and export in multiple formats (PDF, Excel, Word)
- Data security features including backups and easy deletion