AI Graph Maker
Open siteResearch & Data Analysis
Introduction
AI tool for creating diverse graphs and charts effortlessly.
AI Graph Maker Product Information
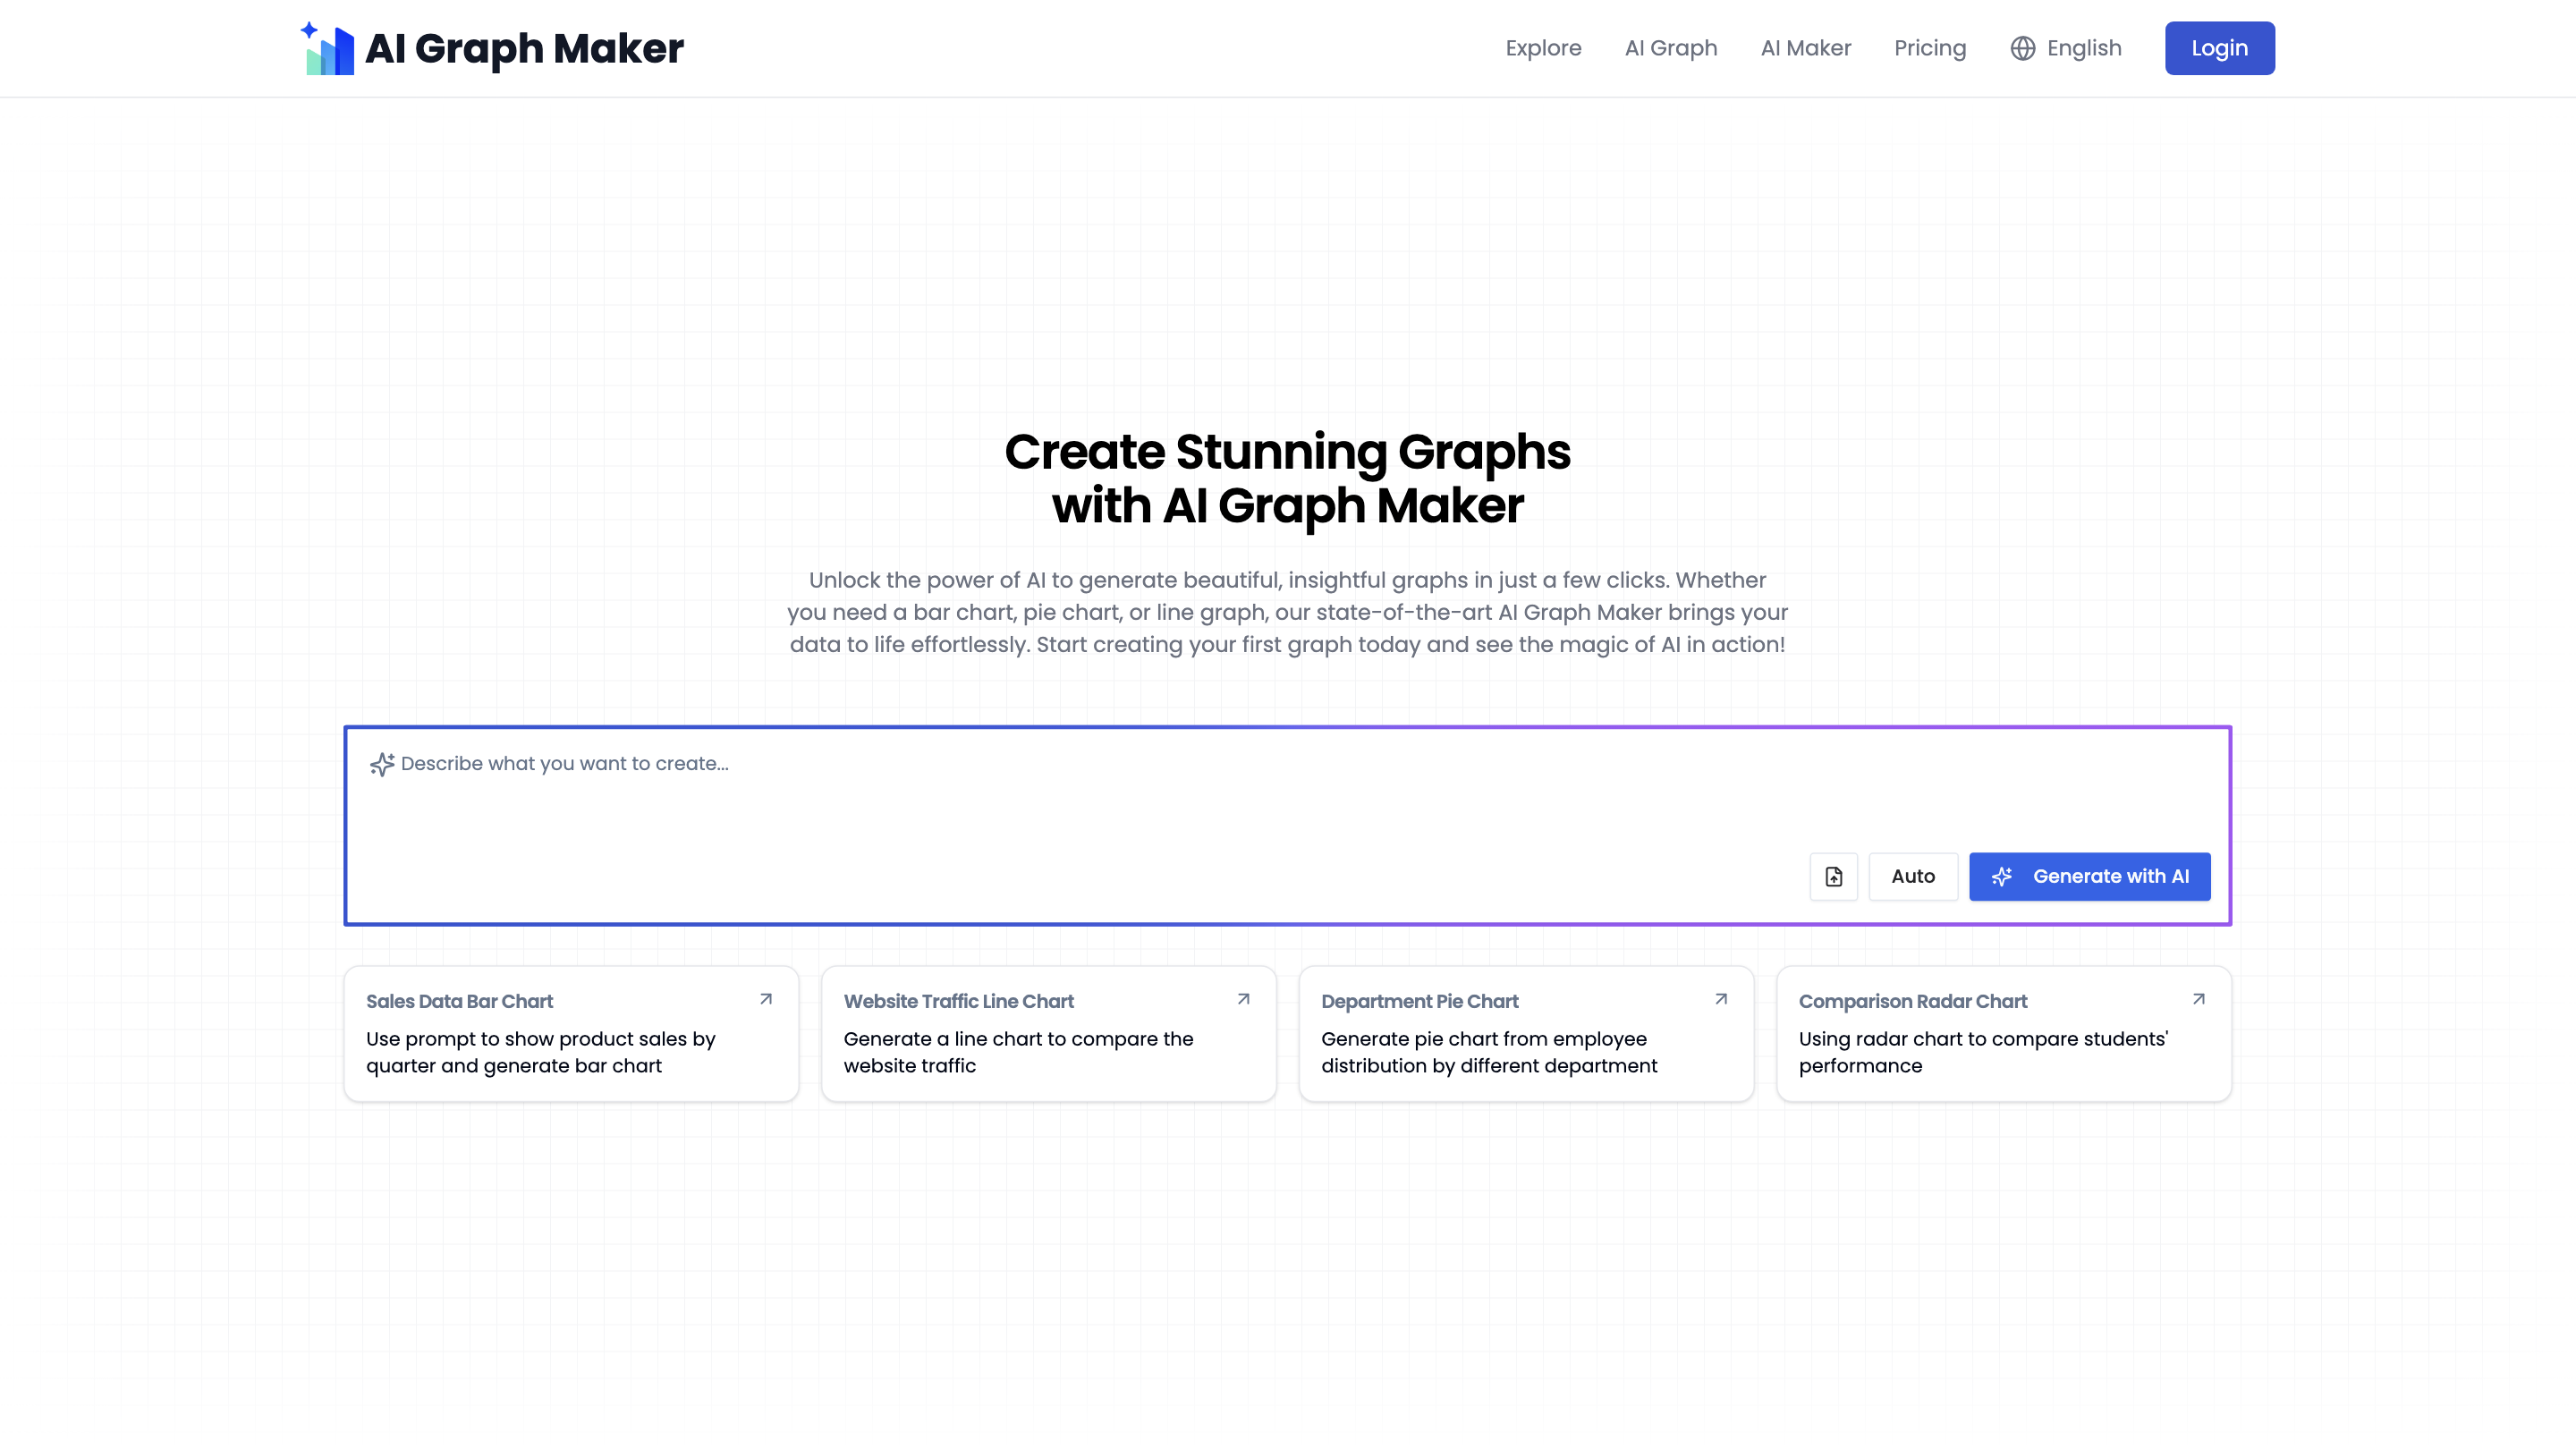
Free AI Graph Maker is an AI-powered tool that lets you generate beautiful, interactive graphs in seconds. It supports a wide range of chart types (bar, pie, line, timeline, flowchart, ER diagrams, mind maps, Gantt charts, and more) and emphasizes ease of use for both beginners and professionals. The platform enables AI-assisted chart creation from data, flexible editing, and multi-format export, making it suitable for presentations, reports, and data analysis.
How to Create a Graph with AI Graph Maker
- Enter Your Data — Input data manually or upload a data file (txt, Excel, etc.).
- Choose Your Graph Type — Pick the type of graph you want to create (bar, pie, line, timeline, flowchart, ER diagram, mind map, etc.).
- Generate with AI — Click the AI generation button to instantly create your graph.
- Edit the Graph — Customize colors, labels, titles, and other elements.
- Download and Share — Export your graph or share it directly.
Features
- AI-generated graphs: Generate accurate and visually appealing charts automatically from your data
- Wide chart variety: Bar, pie, line, timeline, flowchart, ER diagram, mind map, Gantt, pyramid, stacked bar, and more
- Responsive design: Works seamlessly on desktop, tablet, and mobile
- Multi-format export: PNG, SVG, and Mermaid (plus PDF in some workflows) for easy integration
- Flexible editing: Adjust colors, fonts, labels, and styles after generation
- Cross-platform sharing: Exported graphs can be used across different tools and platforms
- User-friendly for all levels: Suitable for both professionals and beginners
How It Works
- The AI Graph Maker analyzes your data and suggests the most suitable chart type and structure.
- You can tailor the visualization by editing content and styling to fit your needs.
- Exports are available in multiple formats to ensure compatibility with various use cases, including further edits in other tools.
Chart Types and Use Cases
- Pie Chart: Proportional representations for market share, demographics, resources
- Line Chart: Trends over time or across ordered categories
- Bar Chart: Comparisons across categories or time periods
- Timeline: Chronological event visualization for projects or history
- Flowchart: Process mapping and software workflows
- ER Diagram: Database schema and data models
- Mind Map: Brainstorming and idea organization
- Gantt Chart: Task progress and project scheduling
- Pyramid and Stacked Bar: Hierarchical or layered data representations
How to Export
- Image formats: PNG
- Vector formats: SVG
- Data formats: Mermaid (for integration with Mermaid-compatible tools)
- Additional formats: PDF (where supported by the workflow)
FAQs (Summary)
- How to create graphs: Go to the graph maker, input data, choose type, generate, edit, export
- Customization: You can adjust data content, colors, fonts, labels, and styles in real time
- Exports: Supported as PNG, SVG, Mermaid, and occasionally PDF
- Help: Technical support available via email for assistance
Why Choose AI Graph Maker
- Quick AI-driven graph generation saves time
- Broad chart type support meets diverse visualization needs
- Simple editing and multiple export options enhance workflow
Core Features
- AI-powered graph generation from data
- Support for pie, line, bar, timeline, flowchart, ER diagrams, mind maps, Gantt charts, pyramids, stacked bars, and more
- Responsive design for any device
- Multiple export formats: PNG, SVG, Mermaid (and PDF where applicable)
- Easy post-generation editing of content and style
- Cross-platform usage and sharing capabilities
- Beginner-friendly yet powerful for professionals