ChatViz
Open siteResearch & Data Analysis
Introduction
Powerful data visualization tool with ChatGPT
ChatViz Product Information
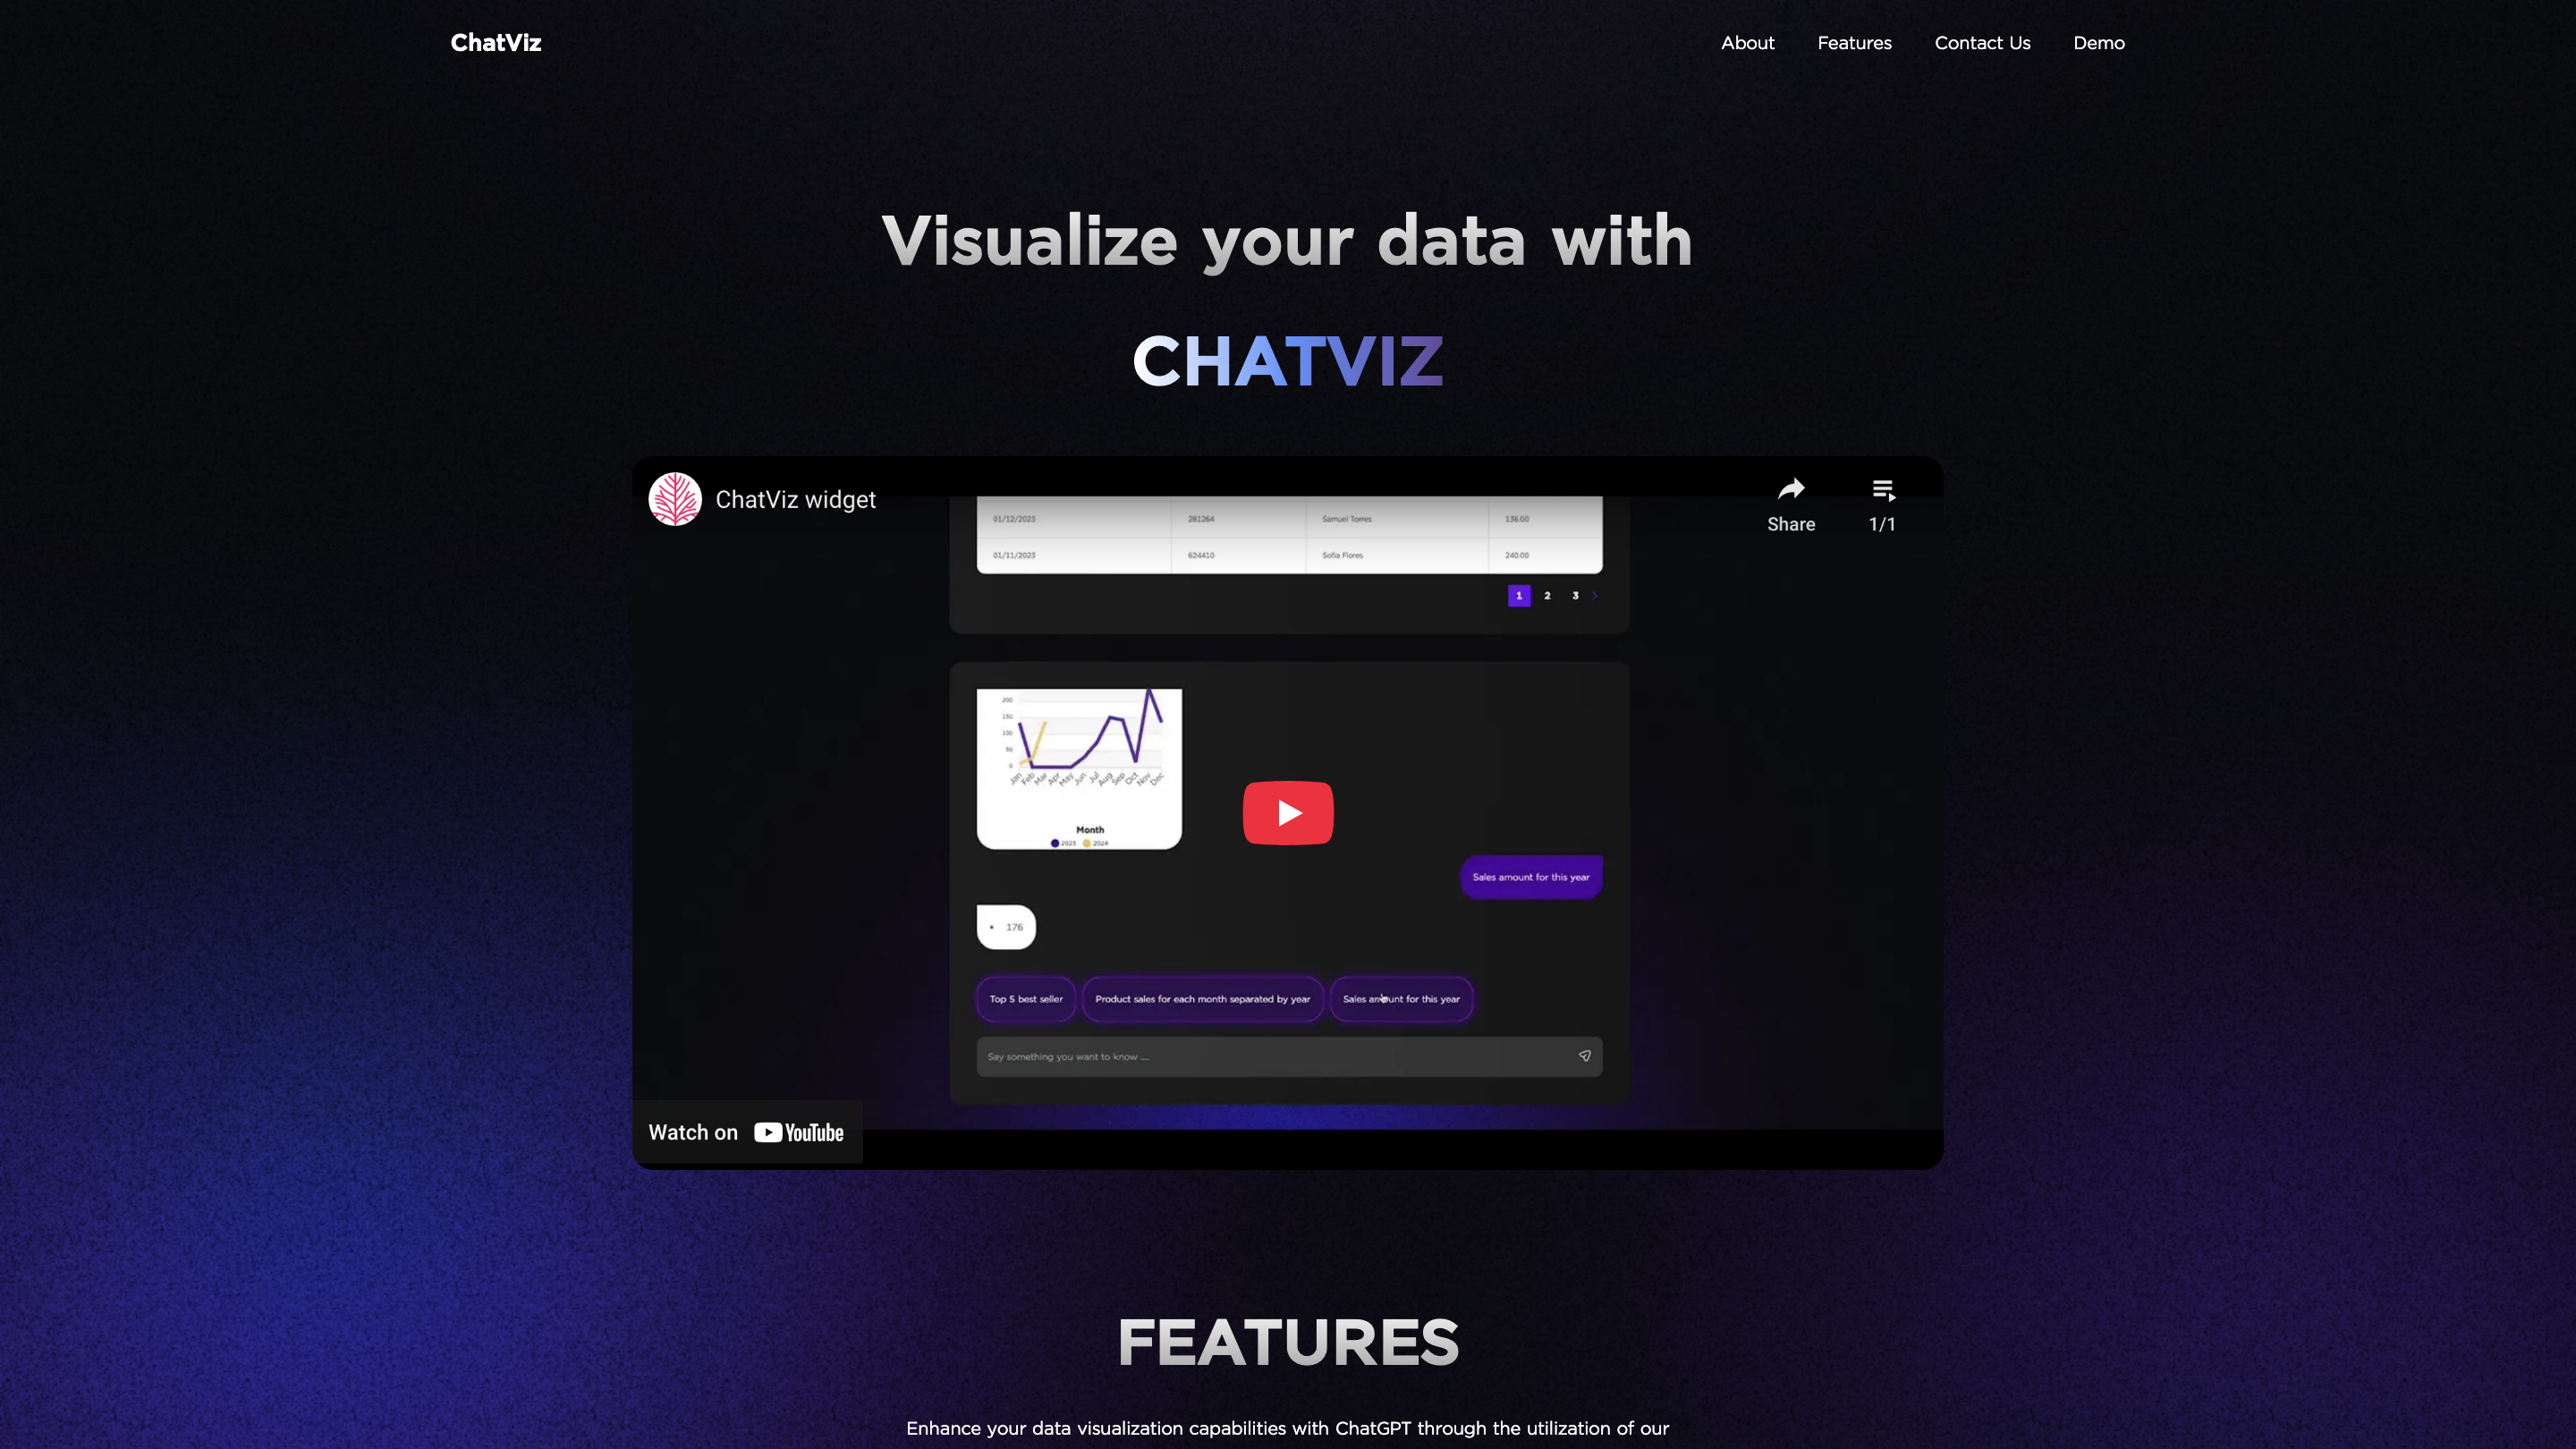
ChatViz - Enhance your data visualization capabilities with ChatGPT.
ChatViz provides two core features to streamline data visualization: an SQL translator and an automatic chart suggestion tool. It aims to reduce dashboard complexity and shorten development time by converting natural language prompts into SQL queries and by generating charts tailored to your dataset.
How ChatViz Works
- SQL Translator: Enter a natural language prompt, and ChatViz generates the corresponding SQL query command for you.
- Chart Suggestion: Input your data, and ChatViz automatically suggests a chart type and configuration that best fits your dataset.
How to Use in 3 Easy Steps
- Configure your SQL schema to ChatViz.
- Set up your webhook to connect with ChatViz.
- ChatViz will visualize the output data from your webhook.
Try It
- Try the Demo to see ChatViz in action.
- Try with our ChatViz widget to visualize outputs from your own systems.
Features
- SQL Translator: Convert natural language prompts into SQL queries.
- Chart Suggestion: Auto-generate chart types and configurations from your data.
- Webhook integration: Connect ChatViz to your data sources for live visualization.
- Quick setup: Three-step integration to visualize webhook outputs.
- Demo and widget availability for hands-on evaluation.
About & Support
- Reach out via the contact options to ask questions or learn more.
- © 2024 Mulberrysoft. All rights reserved.