Clarity
Open siteResearch & Data Analysis
Introduction
Clarity offers a balanced view of news from different political perspectives.
Clarity Product Information
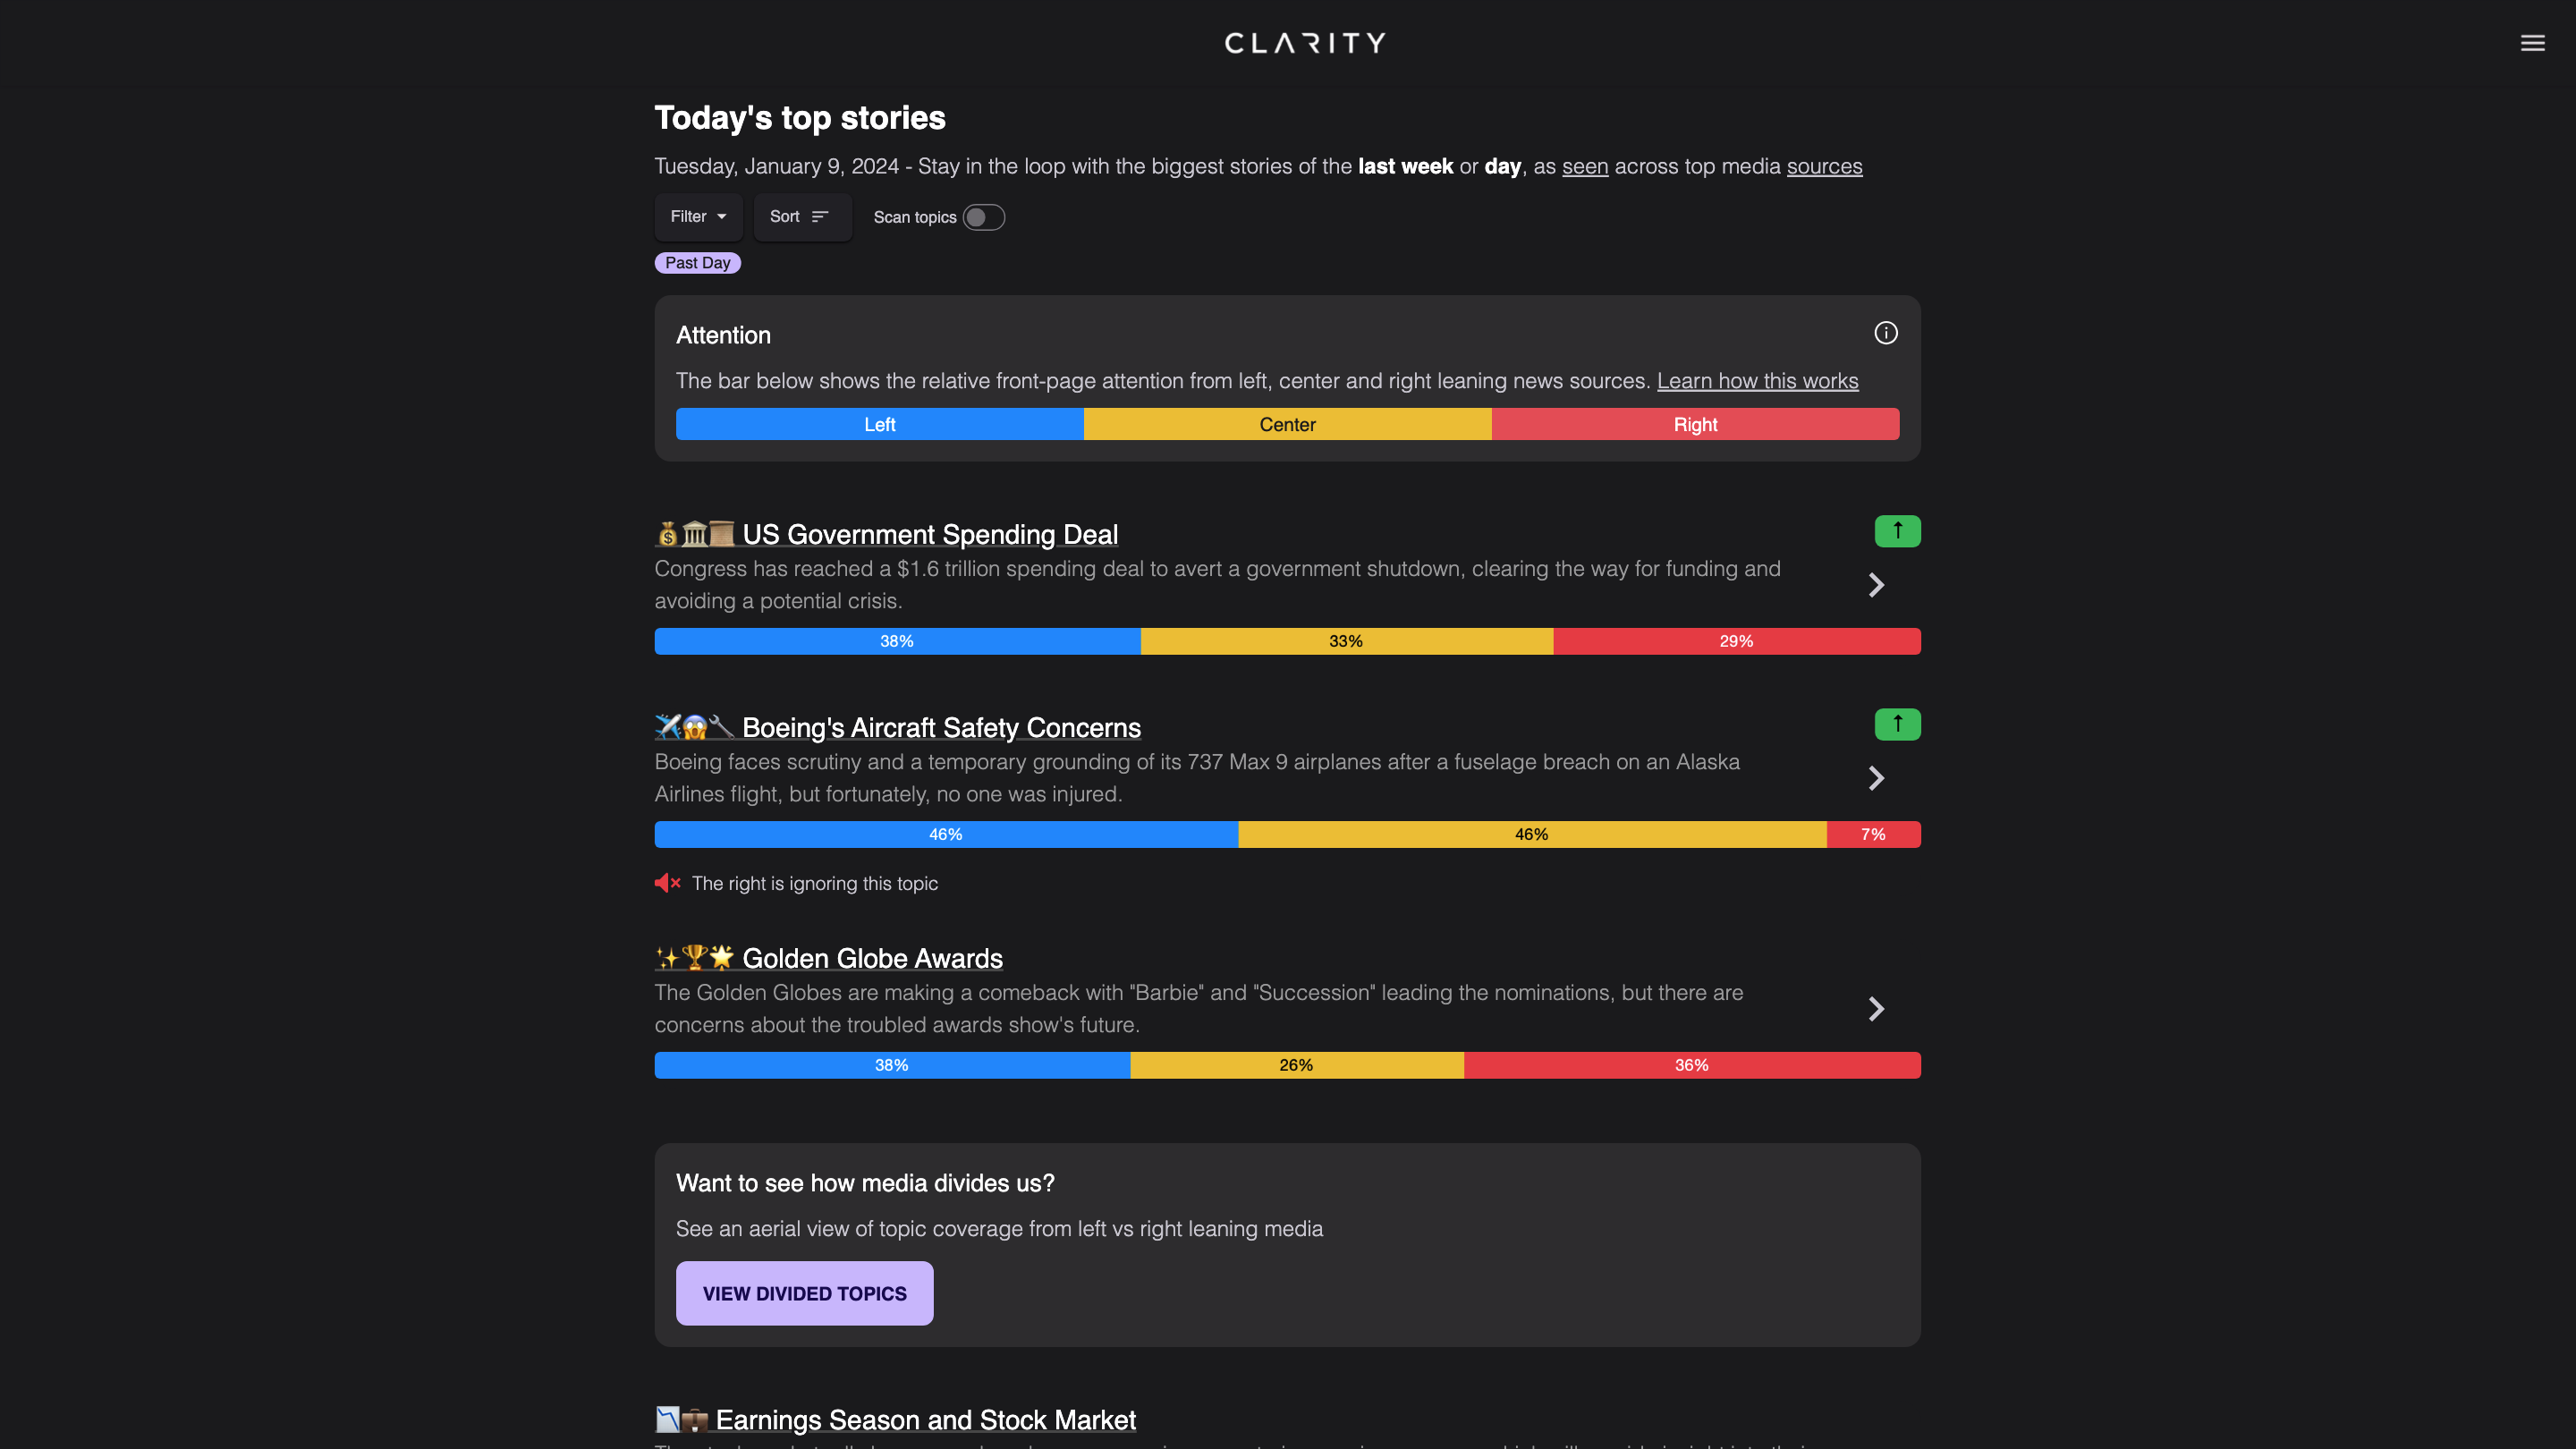
Clarity News Dashboard is an AI-assisted news visualization and analysis tool that aggregates breaking news from diverse political perspectives (left, center, right) without bias, providing real-time front-page attention metrics and topic trends. It organizes coverage by time, topic, and source leaning, helping users understand how different outlets frame the same events and how attention shifts over time.
How it works
- Ingest & Normalize Sources: Pulls front-page headlines from a variety of outlets across left, center, right, and international sources. Headlines are normalized to a consistent schema for cross-source comparison.
- Attention Scoring: Measures attention by the prominence of a topic on the front page (headline position, banner size, and placement). Higher placement yields higher attention scores.
- Divided Topics & Time Views: Displays topics divided by political leaning and visualizes attention over time (Past Day, Past Week) to identify rising or fading stories.
- Source Leaning Insights: Highlights how each topic is treated differently across left, center, right sources, including which side is prioritizing or downplaying a story.
- Interactive Filters: Users can filter by time period, topic, source leaning, and geographic focus to customize the view.
- Recommendations & News Highlights: Provides weekly or daily curated highlights and summaries of notable stories across the spectrum.
How to Use Clarity News Dashboard
- Open the Dashboard to view current top stories and the attention bar indicating cross-source prominence.
- Explore Divided Topics to compare how left, center, and right outlets cover the same event.
- Select Time Period (Past Day / Past Week) to see trends and evolving coverage.
- Filter by Leaning or Topic to drill into specific areas (e.g., economics, politics, international affairs).
- Review Attention Details for each story to understand which outlets are driving attention and how it shifts over time.
Use Cases
- Media literacy and bias analysis by contrasting framing across political leanings.
- Trend spotting for journalists, researchers, and policymakers.
- Personal consumption planning to understand the diversity of coverage on timely topics.
Safety and Legal Considerations
- Presenting aggregated headlines without endorsing any viewpoint; always verify from primary sources for in-depth analysis.
- Data usage follows the providers' terms and is intended for informational purposes.
Core Features
- Real-time aggregation of front-page headlines from left, center, right, and international sources
- Attention-based ranking of topics by front-page prominence
- Divided Topic views to compare framing across political leanings
- Time-based trend visualization (Past Day, Past Week)
- Source-leaning filtering and topic-based filtering
- Interactive filters and customizable dashboards
- Weekly/daily highlights and curated recommended stories
- Accessible summaries to aid media literacy and quick briefing