Rerun
Open siteCoding & Development
Introduction
Rerun is an SDK for logging and visualizing computer vision and robotics data efficiently.
Rerun Product Information
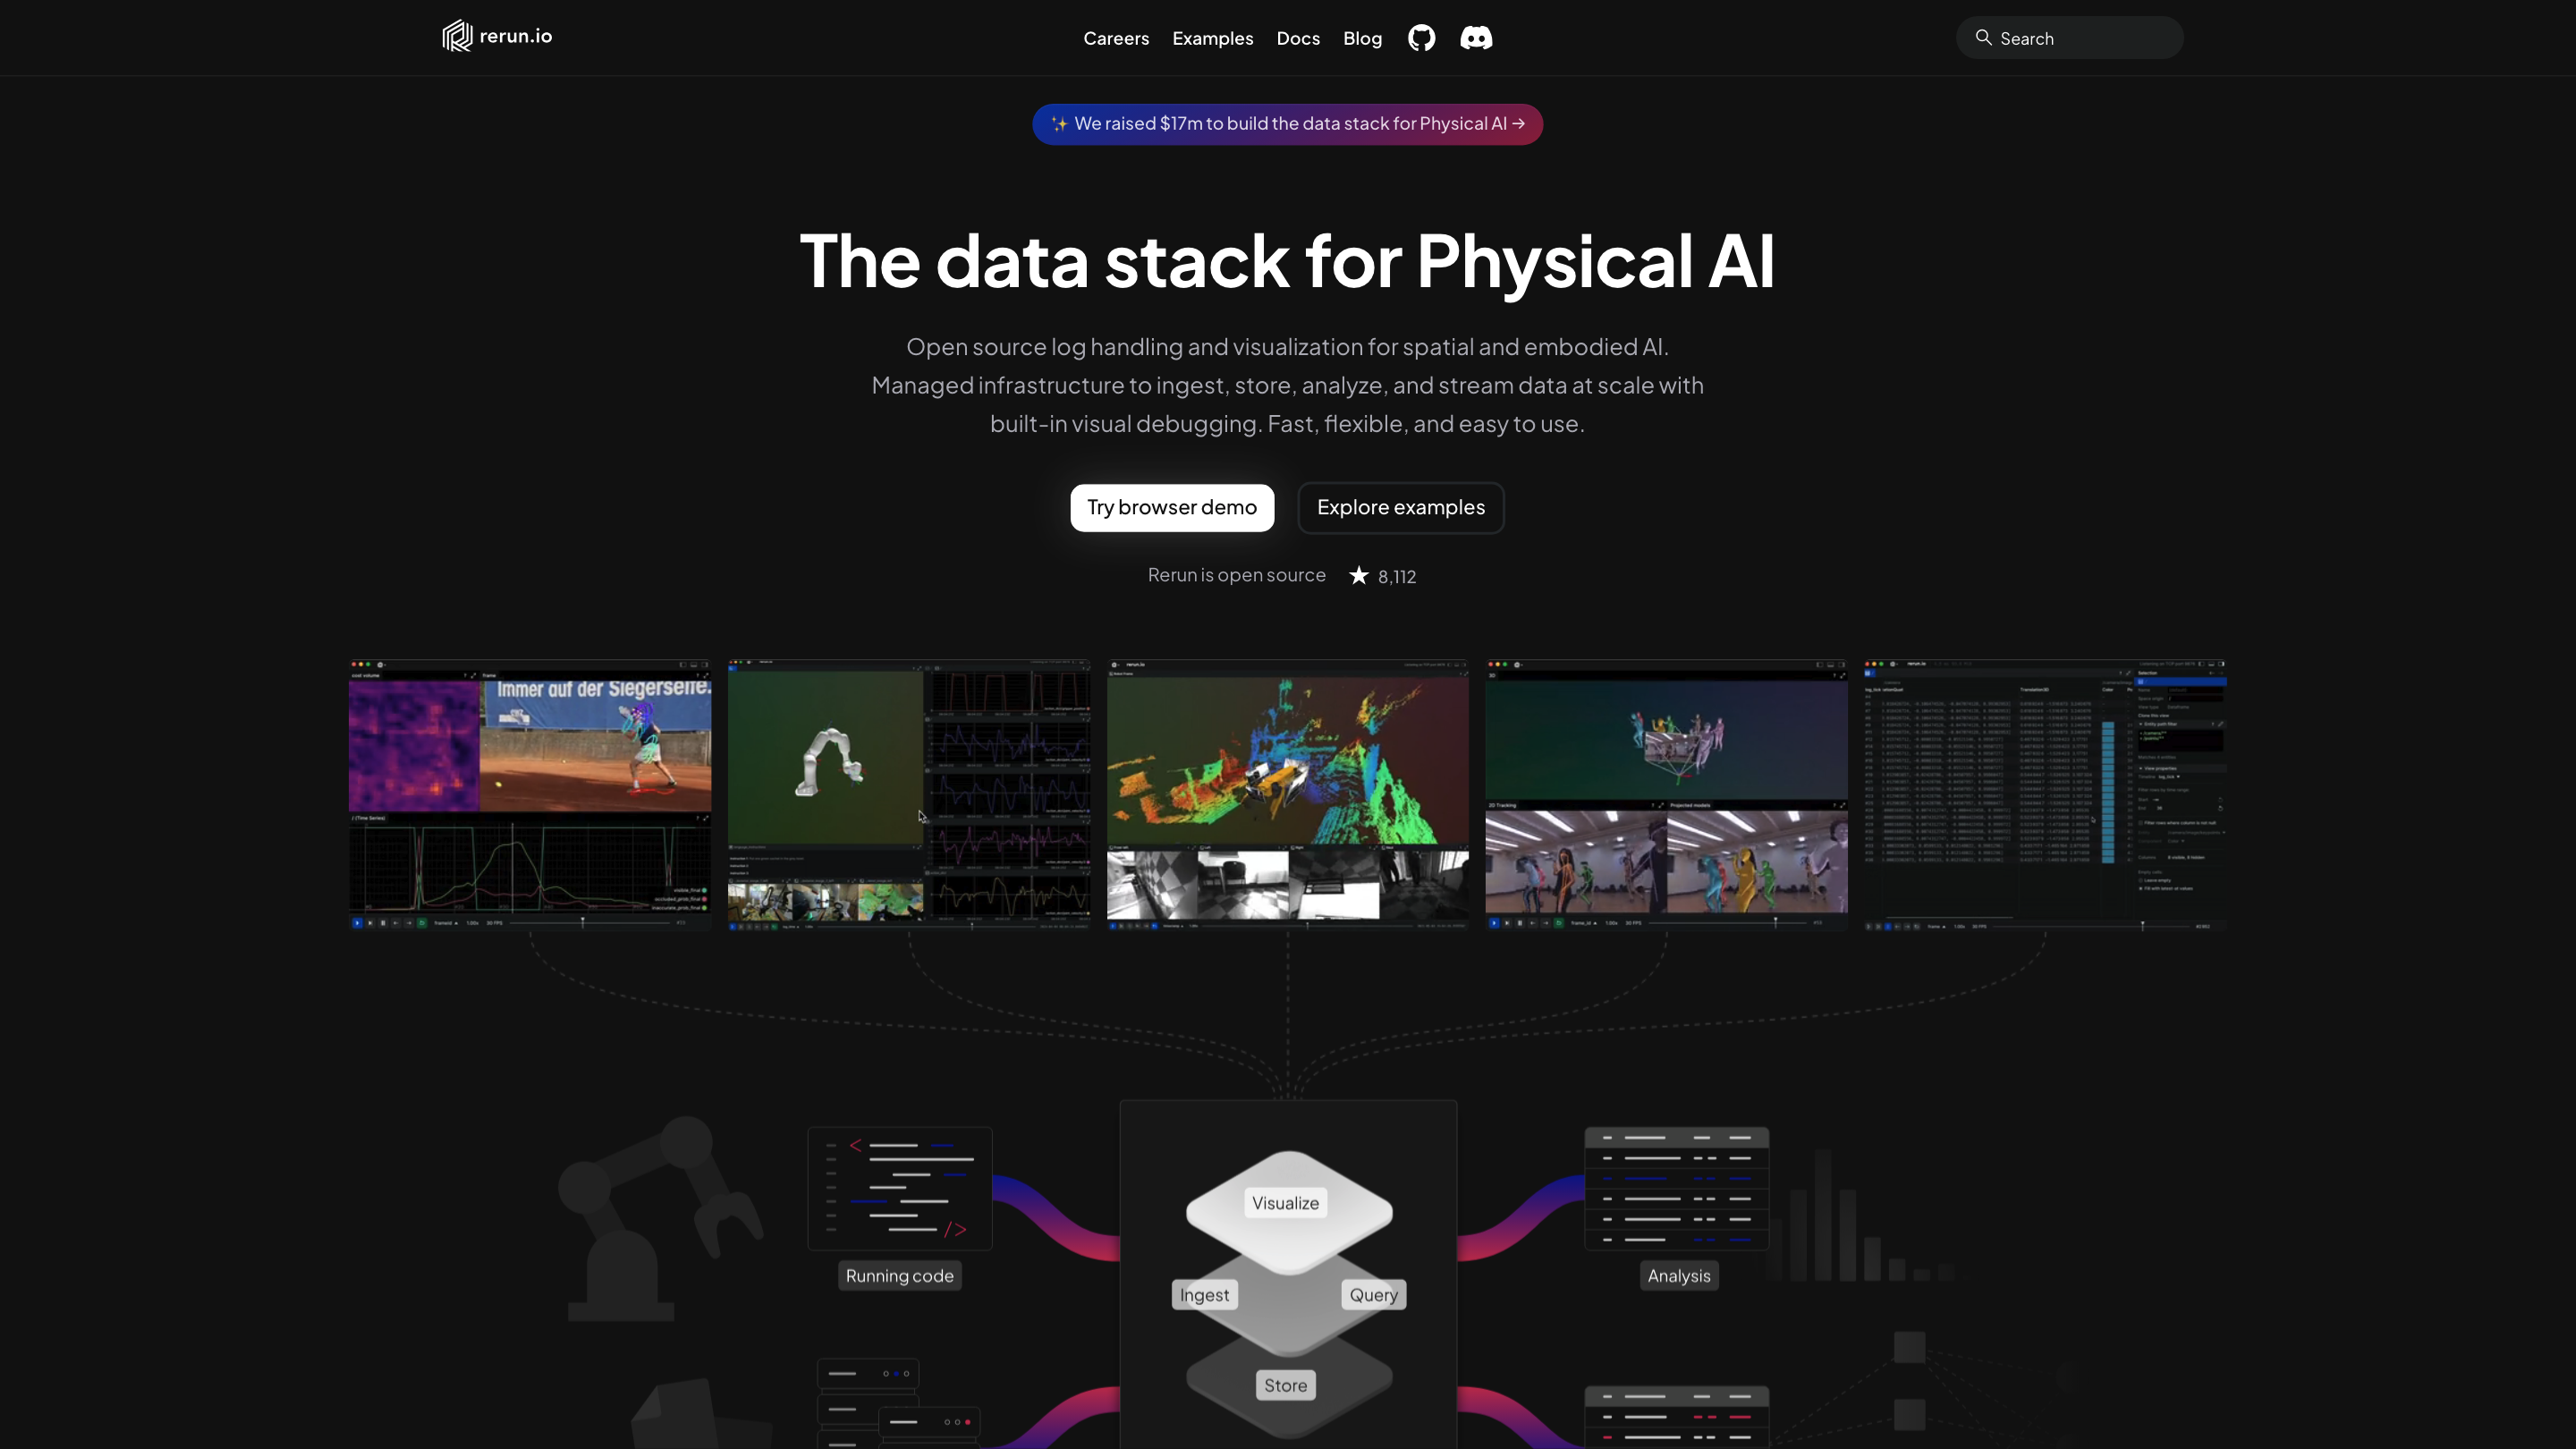
Rerun is an open-source data visualization and logging toolkit designed for spatial and embodied AI. It provides a lightweight, fast, and flexible data engine to ingest, store, visualize, and analyze multimodal data (e.g., points, transforms, images) with time-aware, interactive views. It emphasizes easy setup (no sign-up) and aims to help you run, record, view, build, and query AI system data for debugging, evaluation, and deployment workflows.
How it works
- Use the Rerun SDK (C++, Python, Rust) to model your data and write it to storage or stream it to a live viewer.
- The data model is a time-aware Entity Component System, enabling simple yet flexible representations for common robotics and ML scenarios.
- Visualize live or recorded data with a multimodal viewer that supports time travel, 3D layouts, images, transforms, and more.
- Build visualizations and dashboards by coding or via interactive UI, and embed the viewer into your tools and apps.
- Query APIs extract time-aligned datasets, returning Apache Arrow data for analysis with your favorite dataframes.
Getting started (quick start)
- Install the SDK:
- Python: pip install rerun -sdk
- C++/Rust options are also available (see docs)
- In code (Python example):
- rr.init("my_data_generating_application")
- rr.connect()
- rr.log("points", rr.Points3D(positions))
- rr.log("camera", rr.Transform3D(pos, rot))
- rr.log("camera/image", rr.Image(tensor))
- Open the interactive viewer to observe time-traveling visualizations and inspect signals such as images, 3D transforms, reprojection errors, etc.
Use cases
- Run & record data from systems for analysis and training.
- Visualize training/eval progress and extract time-aligned samples from logs.
- Debug prototypes and diagnose issues with a fast, multimodal viewer.
- Build custom visualizations into your tools and workflows via embedding.
Community & Ecosystem
- Open source, with examples and documentation.
- Integrations and projects like LeRobot, Aria Dataset Explorer, Brush, and kornia-rs demonstrate Rerun’s role in visualization across robotics and ML pipelines.
- Works natively and in the browser; can be embedded in notebooks and web apps.
Safety and Legal Considerations
- Primarily a developer tool for debugging and data analysis; ensure you have appropriate permissions to log and visualize data.
Core Features
- Open-source, no sign-up required for immediate data visualization access
- Time-aware Entity Component System data model for flexible, scalable logging
- Multimodal viewer: visualize points, transforms, images, and more in real-time or from recordings
- Time travel and fast interaction for debugging and analysis
- SDKs in C++, Python, and Rust for flexible integration
- Build and customize visualizations programmatically or via the UI
- Embedding capabilities to integrate the viewer into your apps and tools
- Data extraction via query APIs that return Apache Arrow data for downstream analysis
- Desktop and browser compatibility (native and web runtimes)
- Extensible ecosystem with examples and community-driven projects