SimFin
Open siteLegal & Finance
Introduction
SimFin is a trusted platform for advanced stock analysis and financial insights.
SimFin Product Information
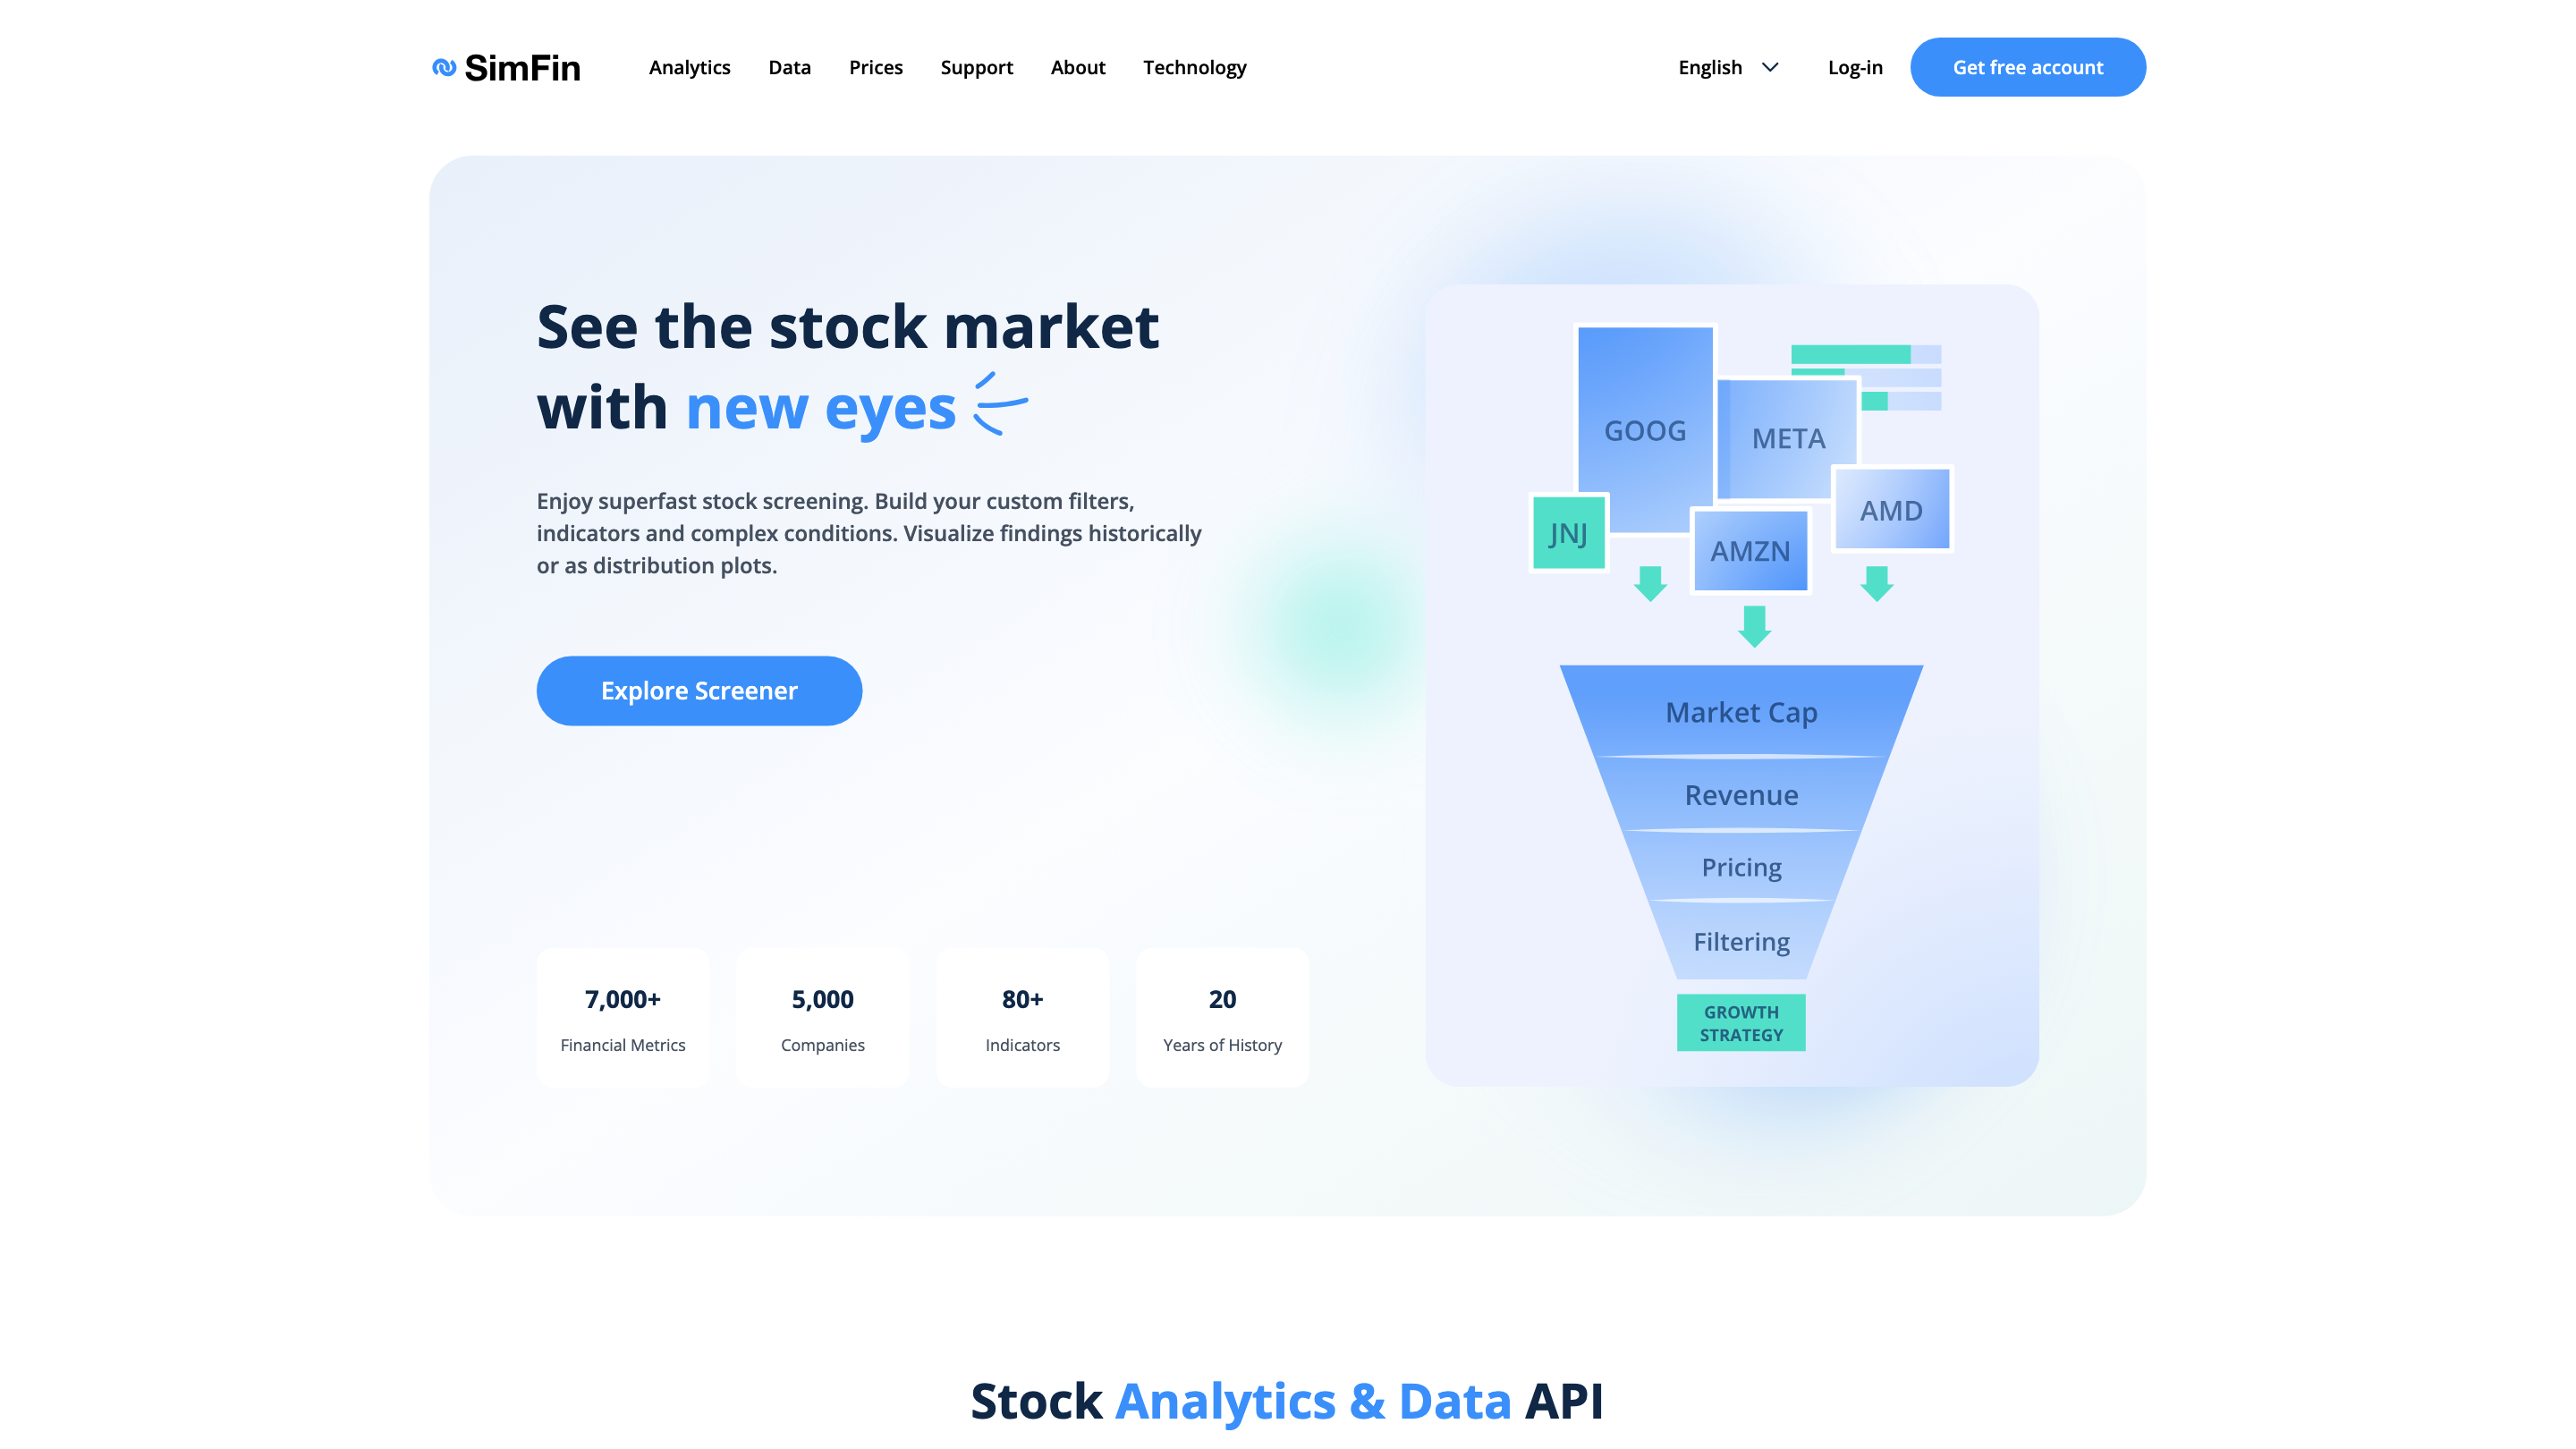
SimFin Analytics is a cloud-based stock screening, analytics, and data platform designed for investors, analysts, and developers. It provides fast access to historical financial data, hundreds of indicators, backtesting capabilities, and tools to visualize, filter, and share investment ideas. The platform emphasizes data-driven decision making with scalable data APIs and downloadable data for use in Python, Excel, or other environments.
Key Capabilities
- Stock screening with dozens of indicators and customizable rules
- Backtesting of studies and dynamic portfolio strategies over 20+ years of history
- Visualization of line charts, distribution plots, scatter plots, and industry/region comparisons
- Access to 7,000+ financial metrics across 5,000+ companies with up to 20 years of history
- Data delivery via API (Python or Excel plugin) or bulk CSV downloads
- Ability to create, copy, and share studies and strategies
- Ready-to-use case studies and cheat sheets to jump-start analysis
- Free account option with optional paid BASIC/PRO tiers for higher data throughput
How to Use SimFin
- Create a free account (optional upgrades available for higher speed data).
- Screen stocks using customizable criteria and built-in indicators.
- Backtest your studies against historical data to validate ideas.
- Visualize results with line charts, distributions, and scatter plots.
- Download data via API or CSV for use in your apps or models.
- Share your insights as studies or strategies with teammates or the broader community.
Note: The data and tools are for informational purposes and should not be construed as financial advice.
Data, API, and Integrations
- 7,000+ financial metrics, 5,000+ companies, 80+ indicators, 20 years of history
- API access to financial data (JSON) and CSV bulk downloads
- Python API and Excel plugin for easy integration into analyses and models
- Visual analytics for comparing metrics across industries and regions
How It Works
- Retrieve fundamentals and calculated metrics for stocks across a long history window.
- Build complex screener queries with custom rules and weights to identify candidates.
- Backtest strategies against historical data to estimate potential performance.
- Visualize data trends and distributions to support decision making.
- Share or export findings as studies or investment ideas.
Safety and Legal Considerations
- The platform provides data and tools for informational and educational purposes.
- Results should not be interpreted as financial advice or a solicitation to buy/sell securities.
Core Features
- Extensive stock screener with dozens of indicators and custom conditions
- Backtesting for single stocks or dynamic portfolio strategies over 20+ years
- Visual analytics: line charts, distributions, and scatter plots
- 7,000+ metrics, 5,000+ companies, 20 years of history
- API access via Python or Excel, plus bulk CSV downloads
- Create, copy, and share studies and investment strategies
- Free account with optional BASIC/PRO upgrades for higher data throughput
- Case studies, cheat sheets, and learning resources